Introduce
Hello, in this article I will outline some of the commands that are commonly used to monitor and debug when working with linux, hopefully it will be useful for you.
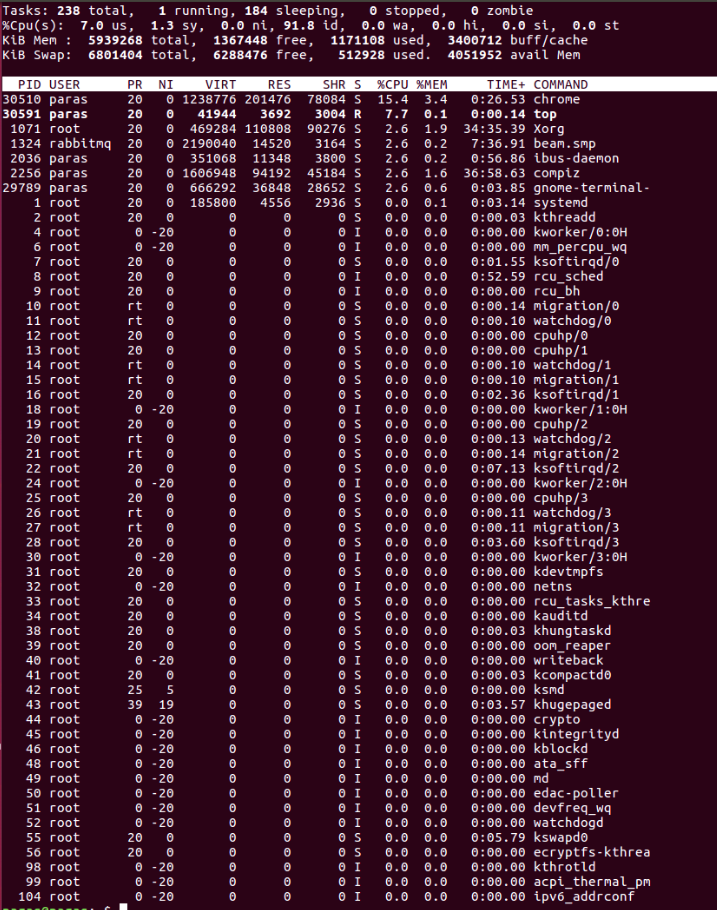
Top – Linux Process Monitoring
Top used for Linux perform monitor. This command is also used to display all running and active real-time processes in an ordered list and update it regularly. It displays CPU usage , Memory usage , Swap Memory , Cache Size , Buffer Size , Process PID , User , Commands and more … The top command is useful for monitoring the system.
1 2 | # top |
You can learn more about this command here .
VmStat – Virtual Memory Statistics
The Linux VmStat command is used to display statistics about virtual memory , kernerl threads , disks , system processes , I/O blocks , interrupts , CPU activity and more. By default, the vmstat command is not available on Linux systems, you need to install a package called sysstat that includes vmstat .
1 2 3 4 5 6 | # vmstat procs -----------memory---------- ---swap-- -----io---- --system-- -----cpu----- r b swpd free inact active si so bi bo in cs us sy id wa st 1 0 0 810420 97380 70628 0 0 115 4 89 79 1 6 90 3 0 |
You can learn more about this command here .
Lsof – List Open Files
The Lsof command is used to display a list of all open files and processes. Open disk files include disk files , network sockets , pipes , devices and processes . With this command, you can easily determine which file is being used. The most common format for this command is.
1 2 3 4 5 6 7 8 9 10 11 12 13 | # lsof COMMAND PID USER FD TYPE DEVICE SIZE NODE NAME init 1 root cwd DIR 104,2 4096 2 / init 1 root rtd DIR 104,2 4096 2 / init 1 root txt REG 104,2 38652 17710339 /sbin/init init 1 root mem REG 104,2 129900 196453 /lib/ld-2.5.so init 1 root mem REG 104,2 1693812 196454 /lib/libc-2.5.so init 1 root mem REG 104,2 20668 196479 /lib/libdl-2.5.so init 1 root mem REG 104,2 245376 196419 /lib/libsepol.so.1 init 1 root mem REG 104,2 93508 196431 /lib/libselinux.so.1 init 1 root 10u FIFO 0,17 953 /dev/initctl |
You can learn more about this command here .
Tcpdump – Network Packet Analyzer
Tcpdump is one of the commands for network packet analyzer or packets sniffer used to capture or filter TCP / IP packets received or transferred over a specific interface over a network. It also provides an option to save captured packages to a file for later analysis.
1 2 3 4 5 6 7 8 | # tcpdump -i eth0 tcpdump: verbose output suppressed, use -v or -vv for full protocol decode listening on eth0, link-type EN10MB (Ethernet), capture size 96 bytes 22:08:59.617628 IP tecmint.com.ssh > 115.113.134.3.static-mumbai.vsnl.net.in.28472: P 2532133365:2532133481(116) ack 3561562349 win 9648 22:09:07.653466 IP tecmint.com.ssh > 115.113.134.3.static-mumbai.vsnl.net.in.28472: P 116:232(116) ack 1 win 9648 22:08:59.617916 IP 115.113.134.3.static-mumbai.vsnl.net.in.28472 > tecmint.com.ssh: . ack 116 win 64347 |
You can learn more about this command here .
Netstat – Network Statistics
Netstat used to keep track of the network’s received and transmitted packet statistics and statistics. It is a very useful tool for every system administrator to monitor network performance and troubleshoot network related problems.
1 2 3 4 5 6 7 8 9 10 11 12 13 14 15 16 | # netstat -a | more Active Internet connections (servers and established) Proto Recv-Q Send-Q Local Address Foreign Address State tcp 0 0 *:mysql *:* LISTEN tcp 0 0 *:sunrpc *:* LISTEN tcp 0 0 *:realm-rusd *:* LISTEN tcp 0 0 *:ftp *:* LISTEN tcp 0 0 localhost.localdomain:ipp *:* LISTEN tcp 0 0 localhost.localdomain:smtp *:* LISTEN tcp 0 0 localhost.localdomain:smtp localhost.localdomain:42709 TIME_WAIT tcp 0 0 localhost.localdomain:smtp localhost.localdomain:42710 TIME_WAIT tcp 0 0 *:http *:* LISTEN tcp 0 0 *:ssh *:* LISTEN tcp 0 0 *:https *:* LISTEN |
You can learn more about this commandhere .
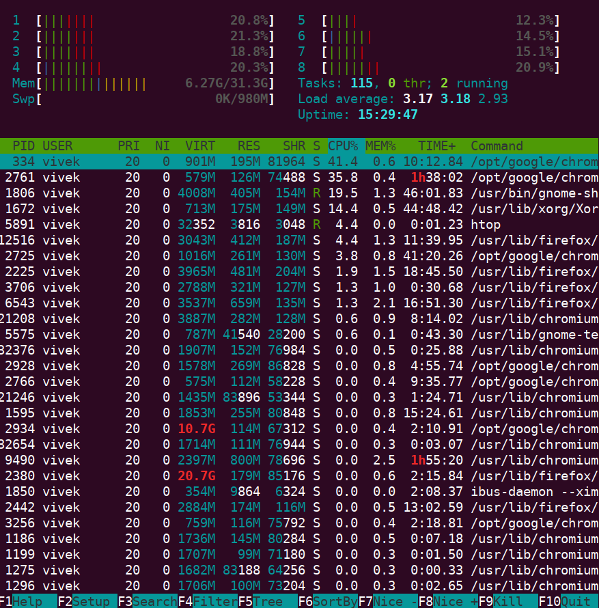
Htop – Linux Process Monitoring
Htop for real-time monitoring of Linux and much more advanced interaction. This is almost identical to the top command but it has some rich features like a user-friendly interface for managing processes, shortcuts, vertical and horizontal views of processes, and more. Htop is a third-party tool and is not included in a Linux system, you need to install it using the YUM package manager tool.
1 2 | # htop |
You can learn more about this command here .
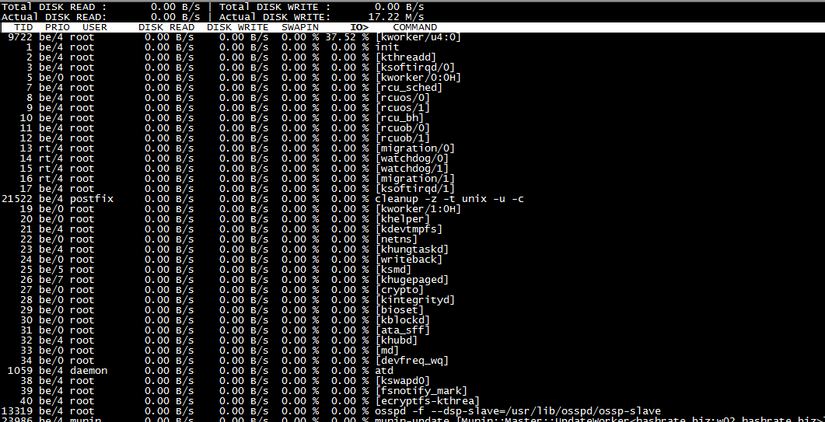
Iotop – Monitor Linux Disk I / O
Iotop is similar to the top and Htop commands, but it has accounting features that track and display real-time Disk I / O and processes . This tool is very useful for finding processes and reading / writing processes on disk.
1 2 | # iotop |
You can learn more about this commandhere .
Iostat – Input / Output Statistics
IoStat is a tool that collects and displays input and output storage device statistics of the system. This tool is commonly used to track performance issues of your storage device including devices, local disks, remote disks such as NFS.
1 2 3 4 5 6 7 8 9 10 11 12 13 14 15 16 | # iostat Linux 2.6.18-238.9.1.el5 (tecmint.com) 09/13/2012 avg-cpu: %user %nice %system %iowait %steal %idle 2.60 3.65 1.04 4.29 0.00 88.42 Device: tps Blk_read/s Blk_wrtn/s Blk_read Blk_wrtn cciss/c0d0 17.79 545.80 256.52 855159769 401914750 cciss/c0d0p1 0.00 0.00 0.00 5459 3518 cciss/c0d0p2 16.45 533.97 245.18 836631746 384153384 cciss/c0d0p3 0.63 5.58 3.97 8737650 6215544 cciss/c0d0p4 0.00 0.00 0.00 8 0 cciss/c0d0p5 0.63 3.79 5.03 5936778 7882528 cciss/c0d0p6 0.08 2.46 2.34 3847771 3659776 |
You can learn more about this command here .
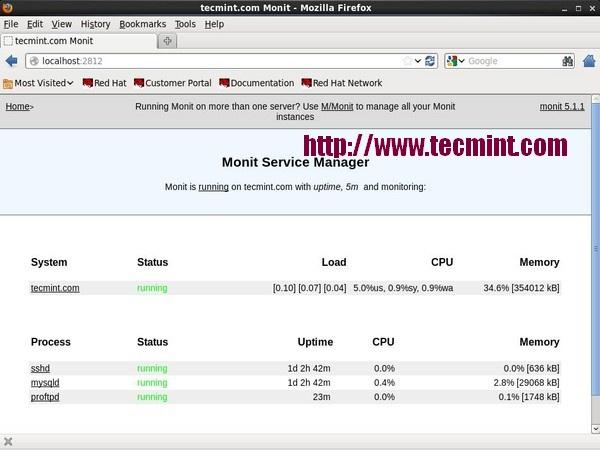
Monit – Linux Process and Services Monitoring
Monit is a free and open source utility that monitors and manages system processes, programs, files, directories, permissions, checksums and filesystems.
It monitors services like Apache, MySQL, Mail, FTP, ProFTP, Nginx, SSH, etc. The system state can be viewed from the command line or using the web interface itself.
You can learn more here .
summary
Above are some commands and tools when working with linux, if you find it useful, do not regret 1 upvote and share.
Happy coding !!!
Reference source: www.tecmint.com