On linux, there are full commands for almost anything, because the GUI may not always be available. When working on the server, there is only shell access and everything must be done from these commands. So today we will look at the commands that can be used to check memory usage on a linux system. Memory includes RAM and swap.
It is important to regularly check the memory usage and the memory used for each process on the server so that resources are not missing and the user can access the server. For example a website. If you are running a web server, then the server must have enough memory to serve visitors to the site. Otherwise, the site will become very slow or even stop working when there is a spike in traffic, simply because the memory will be reduced. It is like what happens on your desktop.
Free statement
The Free command is the simplest and easiest to use to check memory usage on linux. This is a quick example
1 2 3 4 5 6 | $ free -m total used free shared buffers cached Mem: 7976 6459 1517 0 865 2248 -/+ buffers/cache: 3344 4631 Swap: 1951 0 1951 |
Option m shows all data in MB. The total value of 7976 MB is the total amount of RAM installed on the system, ie 8GB. The used column shows the amount of RAM used by linux, in this case about 6.4 GB. The output of this statement is quite easy to understand. What we need to know is cached columns and buffers. The second line tells us that there is 4.6 GB of unused memory. This is free memory in the first line plus buffers and cached .
Linux has a habit of storing many things for faster performance, so that memory can be freed up and used if needed. The last line is swap memory, which in this case is completely free.
- The / Proc / meminfo statement The next way to check memory usage is to read the file
/Proc/meminfo. The file system / Proc does not contain actual files. They are virtual files containing dynamic information about the kernel and the system.
1 2 3 4 5 6 7 8 9 10 11 12 13 14 15 16 17 18 19 20 21 22 23 24 25 26 27 28 29 30 31 32 33 34 35 36 37 38 39 40 41 42 43 44 | $ cat /proc/meminfo MemTotal: 8167848 kB MemFree: 1409696 kB Buffers: 961452 kB Cached: 2347236 kB SwapCached: 0 kB Active: 3124752 kB Inactive: 2781308 kB Active(anon): 2603376 kB Inactive(anon): 309056 kB Active(file): 521376 kB Inactive(file): 2472252 kB Unevictable: 5864 kB Mlocked: 5880 kB SwapTotal: 1998844 kB SwapFree: 1998844 kB Dirty: 7180 kB Writeback: 0 kB AnonPages: 2603272 kB Mapped: 788380 kB Shmem: 311596 kB Slab: 200468 kB SReclaimable: 151760 kB SUnreclaim: 48708 kB KernelStack: 6488 kB PageTables: 78592 kB NFS_Unstable: 0 kB Bounce: 0 kB WritebackTmp: 0 kB CommitLimit: 6082768 kB Committed_AS: 9397536 kB VmallocTotal: 34359738367 kB VmallocUsed: 420204 kB VmallocChunk: 34359311104 kB HardwareCorrupted: 0 kB AnonHugePages: 0 kB HugePages_Total: 0 HugePages_Free: 0 HugePages_Rsvd: 0 HugePages_Surp: 0 Hugepagesize: 2048 kB DirectMap4k: 62464 kB DirectMap2M: 8316928 kB |
Check the values of MemTotal, MemFree, Buffers, Cache, SwapTotal, SwapFree. They indicate memory usage values like the free command.
vmstat
The vmstat command with the s option, gives memory usage statistics like the Proc command. Here is an example
1 2 3 4 5 6 7 8 9 10 11 12 13 14 15 16 17 18 19 20 21 22 23 24 25 26 27 28 29 | $ vmstat -s 8167848 K total memory 7449376 K used memory 3423872 K active memory 3140312 K inactive memory 718472 K free memory 1154464 K buffer memory 2422876 K swap cache 1998844 K total swap 0 K used swap 1998844 K free swap 392650 non-nice user cpu ticks 8073 nice user cpu ticks 83959 system cpu ticks 10448341 idle cpu ticks 91904 IO-wait cpu ticks 0 IRQ cpu ticks 2189 softirq cpu ticks 0 stolen cpu ticks 2042603 pages paged in 2614057 pages paged out 0 pages swapped in 0 pages swapped out 42301605 interrupts 94581566 CPU context switches 1382755972 boot time 8567 forks $ |
The top few lines indicate total memory, free memory, etc.
Command top
The above command is commonly used to check memory and cpu usage for each process. However, it also reports total memory usage and can be used to track total RAM usage. The headers on the output have the necessary information. This is the sample output
1 2 3 4 5 6 7 8 9 10 11 12 | top - 15:20:30 up 6:57, 5 users, load average: 0.64, 0.44, 0.33 Tasks: 265 total, 1 running, 263 sleeping, 0 stopped, 1 zombie %Cpu(s): 7.8 us, 2.4 sy, 0.0 ni, 88.9 id, 0.9 wa, 0.0 hi, 0.0 si, 0.0 st KiB Mem: 8167848 total, 6642360 used, 1525488 free, 1026876 buffers KiB Swap: 1998844 total, 0 used, 1998844 free, 2138148 cached PID USER PR NI VIRT RES SHR S %CPU %MEM TIME+ COMMAND 2986 enlighte 20 0 584m 42m 26m S 14.3 0.5 0:44.27 yakuake 1305 root 20 0 448m 68m 39m S 5.0 0.9 3:33.98 Xorg 7701 enlighte 20 0 424m 17m 10m S 4.0 0.2 0:00.12 kio_thumbnail |
Check out the KiB Mem and KiB Swap . They indicate the total, the used part and the free part of the memory. Buffer and buffer information is also present here, just like the free command.
Htop command
Similar to the top command, the htop command also displays memory usage along with many other details.
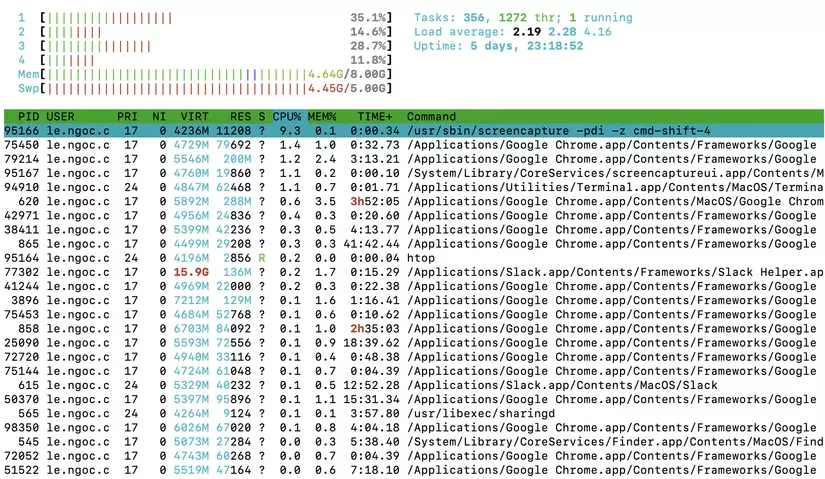
The header at the top shows cpu usage with RAM and Swap memory usage with corresponding figures.
RAM information
To find hardware information about installed RAM, use the demidecode command. It reports a lot of information about installed RAM.
1 2 3 4 5 6 7 8 9 10 11 12 13 14 15 16 17 18 19 20 21 22 23 | $ sudo dmidecode -t 17 # dmidecode 2.11 SMBIOS 2.4 present. Handle 0x0015, DMI type 17, 27 bytes Memory Device Array Handle: 0x0014 Error Information Handle: Not Provided Total Width: 64 bits Data Width: 64 bits Size: 2048 MB Form Factor: DIMM Set: None Locator: J1MY Bank Locator: CHAN A DIMM 0 Type: DDR2 Type Detail: Synchronous Speed: 667 MHz Manufacturer: 0xFF00000000000000 Serial Number: 0xFFFFFFFF Asset Tag: Unknown Part Number: 0x524D32474235383443412D36344643FFFFFF |
Information provided includes size (2048MB), type (DDR2), speed (667 Mhz), etc.
Conclude
All the commands mentioned above work from the terminal and have no gui. When working on desktop with gui, using GUI tool with graphical output will be much easier. The most common tools are gnome-system-Monitor on gnome and ksysguard on KDE. Both provide resource usage information about cpu, ram, swap and network bandwidth in an intuitive and easy to understand graphic.
Refer
https://www.binarytides.com/linux-command-check-memory-usage/