Preface
Hello everyone, it has been a long time since I wrote the article. As you know, when we go to the dashboard, almost every dashboard template will have a statistical chart, maybe one or a lot of graphs that show up the first time I enter. There are many beautiful charting libraries such as Google Chart, ChartJS, Ember Charts, Smothies Charts, … A multitude of charting library packages, in this article, I would recommend to you libraries Vue Chart for drawing charts is extremely simple and convenient.
Story
The precursor of this library is derived from Chart.js , it is very handy and modern, the library is built on HTML5 canvas. It includes 8 different chart types, easy to extend and config to use in Vue. And above all, the beautiful and eye-catching element is all located in this library.
You can install it via npm or yarn
1 2 | yarn add vue <span class="token operator">-</span> chartjs chart <span class="token punctuation">.</span> js or npm install vue <span class="token operator">-</span> chartjs chart <span class="token punctuation">.</span> js <span class="token operator">--</span> save |
Or you can use CDN
1 2 3 | <span class="token operator"><</span> script src <span class="token operator">=</span> <span class="token string">"https://cdnjs.cloudflare.com/ajax/libs/Chart.js/2.7.1/Chart.min.js"</span> <span class="token operator">></span> <span class="token operator"><</span> <span class="token operator">/</span> script <span class="token operator">></span> <span class="token operator"><</span> script src <span class="token operator">=</span> <span class="token string">"https://unpkg.com/vue-chartjs/dist/vue-chartjs.min.js"</span> <span class="token operator">></span> <span class="token operator"><</span> <span class="token operator">/</span> script <span class="token operator">></span> |
User manual
I won’t tell you how to set up the project, because some of you use vue cli normally, some you will use nuxtjs, or have you integrated vue right in the laravel project. I will go directly to the problem that is how to create the chart offline
You need to import base and extend them as stars, create a LineChart.vue file
1 2 3 4 5 6 7 8 9 10 11 | <span class="token operator"><</span> script <span class="token operator">></span> <span class="token keyword">import</span> <span class="token punctuation">{</span> Line <span class="token punctuation">}</span> <span class="token keyword">from</span> <span class="token string">"vue-chartjs"</span> <span class="token punctuation">;</span> <span class="token keyword">export</span> <span class="token keyword">default</span> <span class="token punctuation">{</span> <span class="token keyword">extends</span> <span class="token punctuation">:</span> Line <span class="token punctuation">,</span> <span class="token function">mounted</span> <span class="token punctuation">(</span> <span class="token punctuation">)</span> <span class="token punctuation">{</span> <span class="token keyword">this</span> <span class="token punctuation">.</span> <span class="token function">renderChart</span> <span class="token punctuation">(</span> data <span class="token punctuation">,</span> options <span class="token punctuation">)</span> <span class="token punctuation">}</span> <span class="token punctuation">}</span> <span class="token punctuation">;</span> <span class="token operator"><</span> <span class="token operator">/</span> script <span class="token operator">></span> |
You can replace extends: Line with mixins: [Line] . this.renderChart() is provided by Line component and takes two data and options parameters.
The structure of chartData and options is as follows
1 2 3 4 5 6 7 8 9 10 11 12 13 14 15 16 17 18 19 20 21 22 23 24 25 26 27 28 29 30 31 32 33 34 35 36 37 38 | <span class="token operator"><</span> script <span class="token operator">></span> <span class="token keyword">import</span> <span class="token punctuation">{</span> Line <span class="token punctuation">,</span> mixins <span class="token punctuation">}</span> <span class="token keyword">from</span> <span class="token string">'vue-chartjs'</span> <span class="token punctuation">;</span> <span class="token keyword">const</span> <span class="token punctuation">{</span> reactiveProp <span class="token punctuation">}</span> <span class="token operator">=</span> mixins <span class="token punctuation">;</span> <span class="token keyword">export</span> <span class="token keyword">default</span> <span class="token punctuation">{</span> <span class="token keyword">extends</span> <span class="token punctuation">:</span> Line <span class="token punctuation">,</span> mixins <span class="token punctuation">:</span> <span class="token punctuation">[</span> reactiveProp <span class="token punctuation">]</span> <span class="token punctuation">,</span> props <span class="token punctuation">:</span> <span class="token punctuation">{</span> chartData <span class="token punctuation">:</span> Object <span class="token punctuation">,</span> options <span class="token punctuation">:</span> Object <span class="token punctuation">,</span> <span class="token punctuation">}</span> <span class="token punctuation">,</span> <span class="token function">mounted</span> <span class="token punctuation">(</span> <span class="token punctuation">)</span> <span class="token punctuation">{</span> <span class="token keyword">this</span> <span class="token punctuation">.</span> <span class="token function">renderChart</span> <span class="token punctuation">(</span> <span class="token punctuation">{</span> labels <span class="token punctuation">,</span> datasets <span class="token punctuation">:</span> <span class="token punctuation">[</span> <span class="token punctuation">{</span> label <span class="token punctuation">:</span> <span class="token string">'Average Score'</span> <span class="token punctuation">,</span> data <span class="token punctuation">,</span> backgroundColor <span class="token punctuation">:</span> <span class="token string">'transparent'</span> <span class="token punctuation">,</span> borderColor <span class="token punctuation">:</span> <span class="token string">'rgba(1, 116, 188, 0.50)'</span> <span class="token punctuation">,</span> pointBackgroundColor <span class="token punctuation">:</span> <span class="token string">'rgba(171, 71, 188, 1)'</span> <span class="token punctuation">,</span> <span class="token punctuation">}</span> <span class="token punctuation">,</span> <span class="token punctuation">]</span> <span class="token punctuation">,</span> <span class="token punctuation">}</span> <span class="token punctuation">,</span> <span class="token punctuation">{</span> responsive <span class="token punctuation">:</span> <span class="token boolean">true</span> <span class="token punctuation">,</span> maintainAspectRatio <span class="token punctuation">:</span> <span class="token boolean">false</span> <span class="token punctuation">,</span> title <span class="token punctuation">:</span> <span class="token punctuation">{</span> display <span class="token punctuation">:</span> <span class="token boolean">true</span> <span class="token punctuation">,</span> text <span class="token punctuation">:</span> <span class="token keyword">this</span> <span class="token punctuation">.</span> <span class="token function">$t</span> <span class="token punctuation">(</span> <span class="token string">"Average member's score"</span> <span class="token punctuation">)</span> <span class="token punctuation">,</span> <span class="token punctuation">}</span> <span class="token punctuation">,</span> <span class="token operator">...</span> <span class="token keyword">this</span> <span class="token punctuation">.</span> options <span class="token punctuation">,</span> <span class="token punctuation">}</span> <span class="token punctuation">)</span> <span class="token punctuation">;</span> <span class="token punctuation">}</span> <span class="token punctuation">,</span> <span class="token punctuation">}</span> <span class="token punctuation">;</span> <span class="token operator"><</span> <span class="token operator">/</span> script <span class="token operator">></span> |
If the 2 parameters of the renderChart function you want to pass into the other parent component, you can write as follows
1 2 3 4 5 6 7 8 9 10 11 12 13 14 15 | <span class="token operator"><</span> script <span class="token operator">></span> <span class="token keyword">import</span> <span class="token punctuation">{</span> Line <span class="token punctuation">}</span> <span class="token keyword">from</span> <span class="token string">'vue-chartjs'</span> <span class="token keyword">export</span> <span class="token keyword">default</span> <span class="token punctuation">{</span> <span class="token keyword">extends</span> <span class="token punctuation">:</span> Line <span class="token punctuation">,</span> props <span class="token punctuation">:</span> <span class="token punctuation">[</span> <span class="token string">'chartdata'</span> <span class="token punctuation">,</span> <span class="token string">'options'</span> <span class="token punctuation">]</span> <span class="token punctuation">,</span> <span class="token function">mounted</span> <span class="token punctuation">(</span> <span class="token punctuation">)</span> <span class="token punctuation">{</span> <span class="token keyword">this</span> <span class="token punctuation">.</span> <span class="token function">renderChart</span> <span class="token punctuation">(</span> <span class="token keyword">this</span> <span class="token punctuation">.</span> chartdata <span class="token punctuation">,</span> <span class="token keyword">this</span> <span class="token punctuation">.</span> options <span class="token punctuation">)</span> <span class="token punctuation">}</span> <span class="token punctuation">}</span> <span class="token operator"><</span> <span class="token operator">/</span> script <span class="token operator">></span> <span class="token operator"><</span> style <span class="token operator">></span> <span class="token operator"><</span> <span class="token operator">/</span> style <span class="token operator">></span> |
Note that in this file you should not add the <template></template> tag because Vue will not be able to merge the template. If you add the above tag and have no content, Vue will get the empty content from the component without the extend Line section that you declare in the <script></script> tag below, from which it will output. wrong result.
And one more thing I want to say if you want to update data when you change data from the parent component, you can use reactiveProp or reactiveData mixin. Both 2 minxin are essentially the same, but most of us use reactiveProp . It extends from the logic of the chart component and automatically creates prop with the name chartData and chartData this prop to the vue watch to track if the prop changes, the chart it will be able to redraw automatically. When the data changes, it will call to update() if only the data inside the dataset changes or call to renderChart() if a new dataset is added.
reactiveData simply creates the local chartData variable, it is not the prop passed and it is added to the watcher. This is only used if you need to draw charts that call the API and the API call right inside the chart component.
For example
AreaChart.vue
1 2 3 4 5 6 7 8 9 10 11 12 13 14 15 16 17 18 19 20 21 22 23 24 25 26 27 28 29 30 31 32 33 34 35 36 37 38 39 40 41 42 43 44 45 46 47 48 49 50 51 52 53 54 55 56 57 58 59 60 61 62 63 64 65 | <span class="token operator"><</span> script <span class="token operator">></span> <span class="token keyword">import</span> <span class="token punctuation">{</span> Line <span class="token punctuation">}</span> <span class="token keyword">from</span> <span class="token string">"vue-chartjs"</span> <span class="token punctuation">;</span> <span class="token keyword">export</span> <span class="token keyword">default</span> <span class="token punctuation">{</span> <span class="token keyword">extends</span> <span class="token punctuation">:</span> Line <span class="token punctuation">,</span> <span class="token function">data</span> <span class="token punctuation">(</span> <span class="token punctuation">)</span> <span class="token punctuation">{</span> <span class="token keyword">return</span> <span class="token punctuation">{</span> gradient <span class="token punctuation">:</span> <span class="token keyword">null</span> <span class="token punctuation">,</span> gradient2 <span class="token punctuation">:</span> <span class="token keyword">null</span> <span class="token punctuation">}</span> <span class="token punctuation">;</span> <span class="token punctuation">}</span> <span class="token punctuation">,</span> <span class="token function">mounted</span> <span class="token punctuation">(</span> <span class="token punctuation">)</span> <span class="token punctuation">{</span> <span class="token keyword">this</span> <span class="token punctuation">.</span> gradient <span class="token operator">=</span> <span class="token keyword">this</span> <span class="token punctuation">.</span> $refs <span class="token punctuation">.</span> canvas <span class="token punctuation">.</span> <span class="token function">getContext</span> <span class="token punctuation">(</span> <span class="token string">"2d"</span> <span class="token punctuation">)</span> <span class="token punctuation">.</span> <span class="token function">createLinearGradient</span> <span class="token punctuation">(</span> <span class="token number">0</span> <span class="token punctuation">,</span> <span class="token number">0</span> <span class="token punctuation">,</span> <span class="token number">0</span> <span class="token punctuation">,</span> <span class="token number">450</span> <span class="token punctuation">)</span> <span class="token punctuation">;</span> <span class="token keyword">this</span> <span class="token punctuation">.</span> gradient2 <span class="token operator">=</span> <span class="token keyword">this</span> <span class="token punctuation">.</span> $refs <span class="token punctuation">.</span> canvas <span class="token punctuation">.</span> <span class="token function">getContext</span> <span class="token punctuation">(</span> <span class="token string">"2d"</span> <span class="token punctuation">)</span> <span class="token punctuation">.</span> <span class="token function">createLinearGradient</span> <span class="token punctuation">(</span> <span class="token number">0</span> <span class="token punctuation">,</span> <span class="token number">0</span> <span class="token punctuation">,</span> <span class="token number">0</span> <span class="token punctuation">,</span> <span class="token number">450</span> <span class="token punctuation">)</span> <span class="token punctuation">;</span> <span class="token keyword">this</span> <span class="token punctuation">.</span> gradient <span class="token punctuation">.</span> <span class="token function">addColorStop</span> <span class="token punctuation">(</span> <span class="token number">0</span> <span class="token punctuation">,</span> <span class="token string">"rgba(255, 0,0, 0.5)"</span> <span class="token punctuation">)</span> <span class="token punctuation">;</span> <span class="token keyword">this</span> <span class="token punctuation">.</span> gradient <span class="token punctuation">.</span> <span class="token function">addColorStop</span> <span class="token punctuation">(</span> <span class="token number">0.5</span> <span class="token punctuation">,</span> <span class="token string">"rgba(255, 0, 0, 0.25)"</span> <span class="token punctuation">)</span> <span class="token punctuation">;</span> <span class="token keyword">this</span> <span class="token punctuation">.</span> gradient <span class="token punctuation">.</span> <span class="token function">addColorStop</span> <span class="token punctuation">(</span> <span class="token number">1</span> <span class="token punctuation">,</span> <span class="token string">"rgba(255, 0, 0, 0)"</span> <span class="token punctuation">)</span> <span class="token punctuation">;</span> <span class="token keyword">this</span> <span class="token punctuation">.</span> gradient2 <span class="token punctuation">.</span> <span class="token function">addColorStop</span> <span class="token punctuation">(</span> <span class="token number">0</span> <span class="token punctuation">,</span> <span class="token string">"rgba(0, 231, 255, 0.9)"</span> <span class="token punctuation">)</span> <span class="token punctuation">;</span> <span class="token keyword">this</span> <span class="token punctuation">.</span> gradient2 <span class="token punctuation">.</span> <span class="token function">addColorStop</span> <span class="token punctuation">(</span> <span class="token number">0.5</span> <span class="token punctuation">,</span> <span class="token string">"rgba(0, 231, 255, 0.25)"</span> <span class="token punctuation">)</span> <span class="token punctuation">;</span> <span class="token keyword">this</span> <span class="token punctuation">.</span> gradient2 <span class="token punctuation">.</span> <span class="token function">addColorStop</span> <span class="token punctuation">(</span> <span class="token number">1</span> <span class="token punctuation">,</span> <span class="token string">"rgba(0, 231, 255, 0)"</span> <span class="token punctuation">)</span> <span class="token punctuation">;</span> <span class="token keyword">this</span> <span class="token punctuation">.</span> <span class="token function">renderChart</span> <span class="token punctuation">(</span> <span class="token punctuation">{</span> labels <span class="token punctuation">:</span> <span class="token punctuation">[</span> <span class="token string">"January"</span> <span class="token punctuation">,</span> <span class="token string">"February"</span> <span class="token punctuation">,</span> <span class="token string">"March"</span> <span class="token punctuation">,</span> <span class="token string">"April"</span> <span class="token punctuation">,</span> <span class="token string">"May"</span> <span class="token punctuation">,</span> <span class="token string">"June"</span> <span class="token punctuation">,</span> <span class="token string">"July"</span> <span class="token punctuation">]</span> <span class="token punctuation">,</span> datasets <span class="token punctuation">:</span> <span class="token punctuation">[</span> <span class="token punctuation">{</span> label <span class="token punctuation">:</span> <span class="token string">"Data One"</span> <span class="token punctuation">,</span> borderColor <span class="token punctuation">:</span> <span class="token string">"#FC2525"</span> <span class="token punctuation">,</span> pointBackgroundColor <span class="token punctuation">:</span> <span class="token string">"white"</span> <span class="token punctuation">,</span> borderWidth <span class="token punctuation">:</span> <span class="token number">1</span> <span class="token punctuation">,</span> pointBorderColor <span class="token punctuation">:</span> <span class="token string">"white"</span> <span class="token punctuation">,</span> backgroundColor <span class="token punctuation">:</span> <span class="token keyword">this</span> <span class="token punctuation">.</span> gradient <span class="token punctuation">,</span> data <span class="token punctuation">:</span> <span class="token punctuation">[</span> <span class="token number">40</span> <span class="token punctuation">,</span> <span class="token number">39</span> <span class="token punctuation">,</span> <span class="token number">10</span> <span class="token punctuation">,</span> <span class="token number">40</span> <span class="token punctuation">,</span> <span class="token number">39</span> <span class="token punctuation">,</span> <span class="token number">80</span> <span class="token punctuation">,</span> <span class="token number">40</span> <span class="token punctuation">]</span> <span class="token punctuation">}</span> <span class="token punctuation">,</span> <span class="token punctuation">{</span> label <span class="token punctuation">:</span> <span class="token string">"Data Two"</span> <span class="token punctuation">,</span> borderColor <span class="token punctuation">:</span> <span class="token string">"#05CBE1"</span> <span class="token punctuation">,</span> pointBackgroundColor <span class="token punctuation">:</span> <span class="token string">"white"</span> <span class="token punctuation">,</span> pointBorderColor <span class="token punctuation">:</span> <span class="token string">"white"</span> <span class="token punctuation">,</span> borderWidth <span class="token punctuation">:</span> <span class="token number">1</span> <span class="token punctuation">,</span> backgroundColor <span class="token punctuation">:</span> <span class="token keyword">this</span> <span class="token punctuation">.</span> gradient2 <span class="token punctuation">,</span> data <span class="token punctuation">:</span> <span class="token punctuation">[</span> <span class="token number">60</span> <span class="token punctuation">,</span> <span class="token number">55</span> <span class="token punctuation">,</span> <span class="token number">32</span> <span class="token punctuation">,</span> <span class="token number">10</span> <span class="token punctuation">,</span> <span class="token number">2</span> <span class="token punctuation">,</span> <span class="token number">12</span> <span class="token punctuation">,</span> <span class="token number">53</span> <span class="token punctuation">]</span> <span class="token punctuation">}</span> <span class="token punctuation">]</span> <span class="token punctuation">}</span> <span class="token punctuation">,</span> <span class="token punctuation">{</span> responsive <span class="token punctuation">:</span> <span class="token boolean">true</span> <span class="token punctuation">,</span> maintainAspectRatio <span class="token punctuation">:</span> <span class="token boolean">false</span> <span class="token punctuation">}</span> <span class="token punctuation">)</span> <span class="token punctuation">;</span> <span class="token punctuation">}</span> <span class="token punctuation">}</span> <span class="token punctuation">;</span> <span class="token operator"><</span> <span class="token operator">/</span> script <span class="token operator">></span> |
Result: 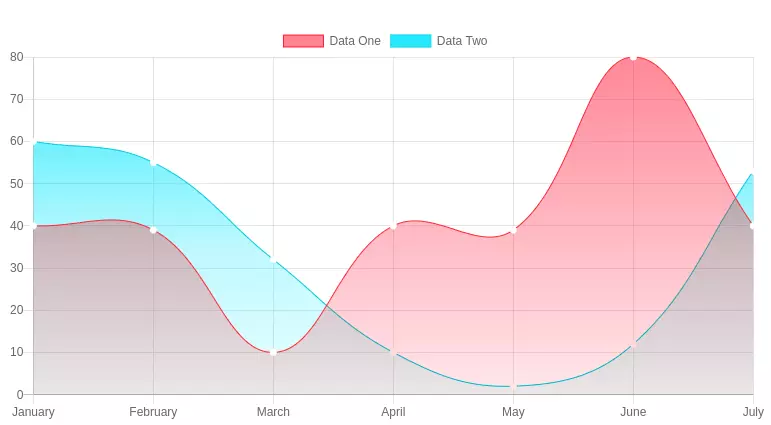
BarChart.vue
1 2 3 4 5 6 7 8 9 10 11 12 13 14 15 16 17 18 19 20 21 22 23 24 25 26 27 28 29 30 31 32 33 34 35 36 37 | <span class="token operator"><</span> script <span class="token operator">></span> <span class="token keyword">import</span> <span class="token punctuation">{</span> Bar <span class="token punctuation">}</span> <span class="token keyword">from</span> <span class="token string">"vue-chartjs"</span> <span class="token punctuation">;</span> <span class="token keyword">export</span> <span class="token keyword">default</span> <span class="token punctuation">{</span> <span class="token keyword">extends</span> <span class="token punctuation">:</span> Bar <span class="token punctuation">,</span> <span class="token function">mounted</span> <span class="token punctuation">(</span> <span class="token punctuation">)</span> <span class="token punctuation">{</span> <span class="token keyword">this</span> <span class="token punctuation">.</span> <span class="token function">renderChart</span> <span class="token punctuation">(</span> <span class="token punctuation">{</span> labels <span class="token punctuation">:</span> <span class="token punctuation">[</span> <span class="token string">"January"</span> <span class="token punctuation">,</span> <span class="token string">"February"</span> <span class="token punctuation">,</span> <span class="token string">"March"</span> <span class="token punctuation">,</span> <span class="token string">"April"</span> <span class="token punctuation">,</span> <span class="token string">"May"</span> <span class="token punctuation">,</span> <span class="token string">"June"</span> <span class="token punctuation">,</span> <span class="token string">"July"</span> <span class="token punctuation">,</span> <span class="token string">"August"</span> <span class="token punctuation">,</span> <span class="token string">"September"</span> <span class="token punctuation">,</span> <span class="token string">"October"</span> <span class="token punctuation">,</span> <span class="token string">"November"</span> <span class="token punctuation">,</span> <span class="token string">"December"</span> <span class="token punctuation">]</span> <span class="token punctuation">,</span> datasets <span class="token punctuation">:</span> <span class="token punctuation">[</span> <span class="token punctuation">{</span> label <span class="token punctuation">:</span> <span class="token string">"Data One"</span> <span class="token punctuation">,</span> backgroundColor <span class="token punctuation">:</span> <span class="token string">"#f87979"</span> <span class="token punctuation">,</span> data <span class="token punctuation">:</span> <span class="token punctuation">[</span> <span class="token number">40</span> <span class="token punctuation">,</span> <span class="token number">20</span> <span class="token punctuation">,</span> <span class="token number">12</span> <span class="token punctuation">,</span> <span class="token number">39</span> <span class="token punctuation">,</span> <span class="token number">10</span> <span class="token punctuation">,</span> <span class="token number">40</span> <span class="token punctuation">,</span> <span class="token number">39</span> <span class="token punctuation">,</span> <span class="token number">80</span> <span class="token punctuation">,</span> <span class="token number">40</span> <span class="token punctuation">,</span> <span class="token number">20</span> <span class="token punctuation">,</span> <span class="token number">12</span> <span class="token punctuation">,</span> <span class="token number">11</span> <span class="token punctuation">]</span> <span class="token punctuation">}</span> <span class="token punctuation">]</span> <span class="token punctuation">}</span> <span class="token punctuation">,</span> <span class="token punctuation">{</span> responsive <span class="token punctuation">:</span> <span class="token boolean">true</span> <span class="token punctuation">,</span> maintainAspectRatio <span class="token punctuation">:</span> <span class="token boolean">false</span> <span class="token punctuation">}</span> <span class="token punctuation">)</span> <span class="token punctuation">;</span> <span class="token punctuation">}</span> <span class="token punctuation">}</span> <span class="token punctuation">;</span> <span class="token operator"><</span> <span class="token operator">/</span> script <span class="token operator">></span> |
Result: 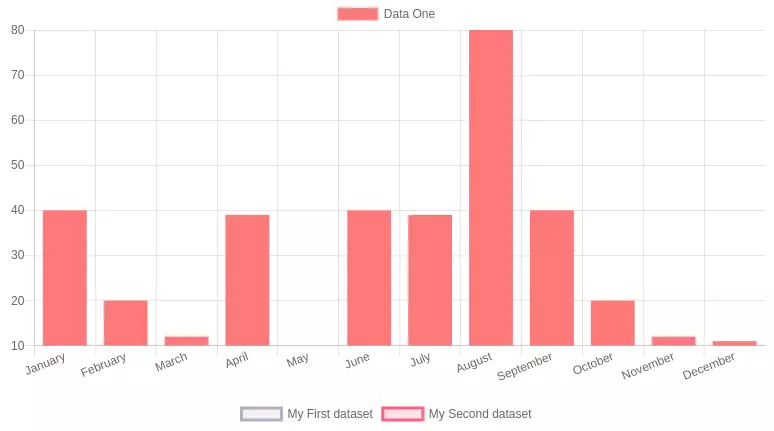
LineChart.vue
1 2 3 4 5 6 7 8 9 10 11 12 13 14 15 16 17 18 19 20 21 22 23 24 25 26 27 28 29 30 31 32 33 34 35 36 37 38 39 40 | <span class="token operator"><</span> script <span class="token operator">></span> <span class="token keyword">import</span> <span class="token punctuation">{</span> Line <span class="token punctuation">}</span> <span class="token keyword">from</span> <span class="token string">"vue-chartjs"</span> <span class="token punctuation">;</span> <span class="token keyword">export</span> <span class="token keyword">default</span> <span class="token punctuation">{</span> <span class="token keyword">extends</span> <span class="token punctuation">:</span> Line <span class="token punctuation">,</span> <span class="token function">mounted</span> <span class="token punctuation">(</span> <span class="token punctuation">)</span> <span class="token punctuation">{</span> <span class="token keyword">this</span> <span class="token punctuation">.</span> <span class="token function">renderChart</span> <span class="token punctuation">(</span> <span class="token punctuation">{</span> labels <span class="token punctuation">:</span> <span class="token punctuation">[</span> <span class="token string">"January"</span> <span class="token punctuation">,</span> <span class="token string">"February"</span> <span class="token punctuation">,</span> <span class="token string">"March"</span> <span class="token punctuation">,</span> <span class="token string">"April"</span> <span class="token punctuation">,</span> <span class="token string">"May"</span> <span class="token punctuation">,</span> <span class="token string">"June"</span> <span class="token punctuation">,</span> <span class="token string">"July"</span> <span class="token punctuation">]</span> <span class="token punctuation">,</span> datasets <span class="token punctuation">:</span> <span class="token punctuation">[</span> <span class="token punctuation">{</span> label <span class="token punctuation">:</span> <span class="token string">"Data 1"</span> <span class="token punctuation">,</span> data <span class="token punctuation">:</span> <span class="token punctuation">[</span> <span class="token number">2</span> <span class="token punctuation">,</span> <span class="token number">10</span> <span class="token punctuation">,</span> <span class="token number">5</span> <span class="token punctuation">,</span> <span class="token number">9</span> <span class="token punctuation">,</span> <span class="token number">0</span> <span class="token punctuation">,</span> <span class="token number">6</span> <span class="token punctuation">,</span> <span class="token number">20</span> <span class="token punctuation">]</span> <span class="token punctuation">,</span> backgroundColor <span class="token punctuation">:</span> <span class="token string">"transparent"</span> <span class="token punctuation">,</span> borderColor <span class="token punctuation">:</span> <span class="token string">"rgba(1, 116, 188, 0.50)"</span> <span class="token punctuation">,</span> pointBackgroundColor <span class="token punctuation">:</span> <span class="token string">"rgba(171, 71, 188, 1)"</span> <span class="token punctuation">}</span> <span class="token punctuation">]</span> <span class="token punctuation">}</span> <span class="token punctuation">,</span> <span class="token punctuation">{</span> responsive <span class="token punctuation">:</span> <span class="token boolean">true</span> <span class="token punctuation">,</span> maintainAspectRatio <span class="token punctuation">:</span> <span class="token boolean">false</span> <span class="token punctuation">,</span> title <span class="token punctuation">:</span> <span class="token punctuation">{</span> display <span class="token punctuation">:</span> <span class="token boolean">true</span> <span class="token punctuation">,</span> text <span class="token punctuation">:</span> <span class="token string">"My Data"</span> <span class="token punctuation">}</span> <span class="token punctuation">}</span> <span class="token punctuation">)</span> <span class="token punctuation">;</span> <span class="token punctuation">}</span> <span class="token punctuation">}</span> <span class="token punctuation">;</span> <span class="token operator"><</span> <span class="token operator">/</span> script <span class="token operator">></span> |
Result: 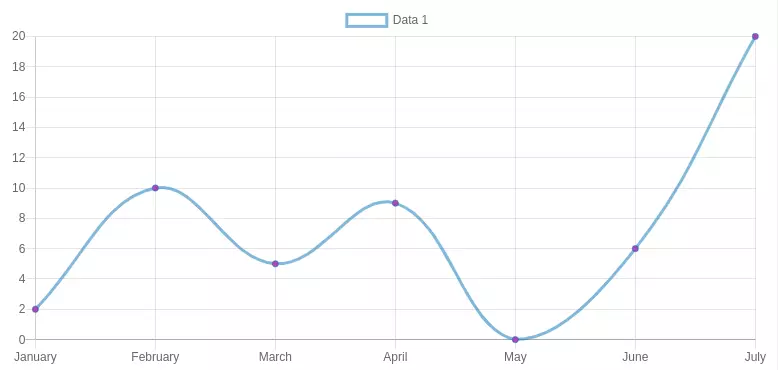
PieChart.vue
1 2 3 4 5 6 7 8 9 10 11 12 13 14 15 16 17 18 19 20 21 22 23 24 25 26 27 28 29 30 31 32 33 34 35 36 | <span class="token operator"><</span> script <span class="token operator">></span> <span class="token keyword">import</span> <span class="token punctuation">{</span> Pie <span class="token punctuation">}</span> <span class="token keyword">from</span> <span class="token string">"vue-chartjs"</span> <span class="token punctuation">;</span> <span class="token keyword">export</span> <span class="token keyword">default</span> <span class="token punctuation">{</span> <span class="token keyword">extends</span> <span class="token punctuation">:</span> Pie <span class="token punctuation">,</span> <span class="token function">mounted</span> <span class="token punctuation">(</span> <span class="token punctuation">)</span> <span class="token punctuation">{</span> <span class="token keyword">this</span> <span class="token punctuation">.</span> gradient <span class="token operator">=</span> <span class="token keyword">this</span> <span class="token punctuation">.</span> $refs <span class="token punctuation">.</span> canvas <span class="token punctuation">.</span> <span class="token function">getContext</span> <span class="token punctuation">(</span> <span class="token string">"2d"</span> <span class="token punctuation">)</span> <span class="token punctuation">.</span> <span class="token function">createLinearGradient</span> <span class="token punctuation">(</span> <span class="token number">0</span> <span class="token punctuation">,</span> <span class="token number">0</span> <span class="token punctuation">,</span> <span class="token number">0</span> <span class="token punctuation">,</span> <span class="token number">450</span> <span class="token punctuation">)</span> <span class="token punctuation">;</span> <span class="token keyword">this</span> <span class="token punctuation">.</span> gradient2 <span class="token operator">=</span> <span class="token keyword">this</span> <span class="token punctuation">.</span> $refs <span class="token punctuation">.</span> canvas <span class="token punctuation">.</span> <span class="token function">getContext</span> <span class="token punctuation">(</span> <span class="token string">"2d"</span> <span class="token punctuation">)</span> <span class="token punctuation">.</span> <span class="token function">createLinearGradient</span> <span class="token punctuation">(</span> <span class="token number">0</span> <span class="token punctuation">,</span> <span class="token number">0</span> <span class="token punctuation">,</span> <span class="token number">0</span> <span class="token punctuation">,</span> <span class="token number">450</span> <span class="token punctuation">)</span> <span class="token punctuation">;</span> <span class="token keyword">this</span> <span class="token punctuation">.</span> gradient <span class="token punctuation">.</span> <span class="token function">addColorStop</span> <span class="token punctuation">(</span> <span class="token number">0</span> <span class="token punctuation">,</span> <span class="token string">"rgba(255, 0,0, 0.5)"</span> <span class="token punctuation">)</span> <span class="token punctuation">;</span> <span class="token keyword">this</span> <span class="token punctuation">.</span> gradient <span class="token punctuation">.</span> <span class="token function">addColorStop</span> <span class="token punctuation">(</span> <span class="token number">0.5</span> <span class="token punctuation">,</span> <span class="token string">"rgba(255, 0, 0, 0.25)"</span> <span class="token punctuation">)</span> <span class="token punctuation">;</span> <span class="token keyword">this</span> <span class="token punctuation">.</span> gradient <span class="token punctuation">.</span> <span class="token function">addColorStop</span> <span class="token punctuation">(</span> <span class="token number">1</span> <span class="token punctuation">,</span> <span class="token string">"rgba(255, 0, 0, 0)"</span> <span class="token punctuation">)</span> <span class="token punctuation">;</span> <span class="token keyword">this</span> <span class="token punctuation">.</span> gradient2 <span class="token punctuation">.</span> <span class="token function">addColorStop</span> <span class="token punctuation">(</span> <span class="token number">0</span> <span class="token punctuation">,</span> <span class="token string">"rgba(0, 231, 255, 0.9)"</span> <span class="token punctuation">)</span> <span class="token punctuation">;</span> <span class="token keyword">this</span> <span class="token punctuation">.</span> gradient2 <span class="token punctuation">.</span> <span class="token function">addColorStop</span> <span class="token punctuation">(</span> <span class="token number">0.5</span> <span class="token punctuation">,</span> <span class="token string">"rgba(0, 231, 255, 0.25)"</span> <span class="token punctuation">)</span> <span class="token punctuation">;</span> <span class="token keyword">this</span> <span class="token punctuation">.</span> gradient2 <span class="token punctuation">.</span> <span class="token function">addColorStop</span> <span class="token punctuation">(</span> <span class="token number">1</span> <span class="token punctuation">,</span> <span class="token string">"rgba(0, 231, 255, 0)"</span> <span class="token punctuation">)</span> <span class="token punctuation">;</span> <span class="token keyword">this</span> <span class="token punctuation">.</span> <span class="token function">renderChart</span> <span class="token punctuation">(</span> <span class="token punctuation">{</span> labels <span class="token punctuation">:</span> <span class="token punctuation">[</span> <span class="token string">"Books"</span> <span class="token punctuation">,</span> <span class="token string">"Magazines"</span> <span class="token punctuation">,</span> <span class="token string">"Newspapers"</span> <span class="token punctuation">]</span> <span class="token punctuation">,</span> datasets <span class="token punctuation">:</span> <span class="token punctuation">[</span> <span class="token punctuation">{</span> backgroundColor <span class="token punctuation">:</span> <span class="token punctuation">[</span> <span class="token keyword">this</span> <span class="token punctuation">.</span> gradient <span class="token punctuation">,</span> <span class="token keyword">this</span> <span class="token punctuation">.</span> gradient2 <span class="token punctuation">,</span> <span class="token string">"#00D8FF"</span> <span class="token punctuation">]</span> <span class="token punctuation">,</span> data <span class="token punctuation">:</span> <span class="token punctuation">[</span> <span class="token number">40</span> <span class="token punctuation">,</span> <span class="token number">20</span> <span class="token punctuation">,</span> <span class="token number">10</span> <span class="token punctuation">]</span> <span class="token punctuation">}</span> <span class="token punctuation">]</span> <span class="token punctuation">}</span> <span class="token punctuation">,</span> <span class="token punctuation">{</span> responsive <span class="token punctuation">:</span> <span class="token boolean">true</span> <span class="token punctuation">,</span> maintainAspectRatio <span class="token punctuation">:</span> <span class="token boolean">false</span> <span class="token punctuation">}</span> <span class="token punctuation">)</span> <span class="token punctuation">;</span> <span class="token punctuation">}</span> <span class="token punctuation">}</span> <span class="token punctuation">;</span> <span class="token operator"><</span> <span class="token operator">/</span> script <span class="token operator">></span> |
Result: 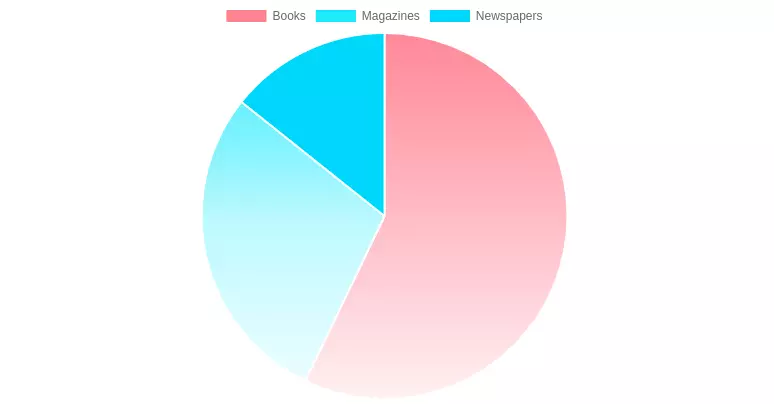
RadarChart.vue
1 2 3 4 5 6 7 8 9 10 11 12 13 14 15 16 17 18 19 20 21 22 23 24 25 26 27 28 29 30 31 32 33 34 35 36 37 38 39 40 41 42 43 44 45 46 | <span class="token operator"><</span> script <span class="token operator">></span> <span class="token keyword">import</span> <span class="token punctuation">{</span> Radar <span class="token punctuation">}</span> <span class="token keyword">from</span> <span class="token string">"vue-chartjs"</span> <span class="token punctuation">;</span> <span class="token keyword">export</span> <span class="token keyword">default</span> <span class="token punctuation">{</span> <span class="token keyword">extends</span> <span class="token punctuation">:</span> Radar <span class="token punctuation">,</span> <span class="token function">mounted</span> <span class="token punctuation">(</span> <span class="token punctuation">)</span> <span class="token punctuation">{</span> <span class="token keyword">this</span> <span class="token punctuation">.</span> <span class="token function">renderChart</span> <span class="token punctuation">(</span> <span class="token punctuation">{</span> labels <span class="token punctuation">:</span> <span class="token punctuation">[</span> <span class="token string">"Eating"</span> <span class="token punctuation">,</span> <span class="token string">"Drinking"</span> <span class="token punctuation">,</span> <span class="token string">"Sleeping"</span> <span class="token punctuation">,</span> <span class="token string">"Designing"</span> <span class="token punctuation">,</span> <span class="token string">"Coding"</span> <span class="token punctuation">,</span> <span class="token string">"Cycling"</span> <span class="token punctuation">,</span> <span class="token string">"Running"</span> <span class="token punctuation">]</span> <span class="token punctuation">,</span> datasets <span class="token punctuation">:</span> <span class="token punctuation">[</span> <span class="token punctuation">{</span> label <span class="token punctuation">:</span> <span class="token string">"My First dataset"</span> <span class="token punctuation">,</span> backgroundColor <span class="token punctuation">:</span> <span class="token string">"rgba(179,181,198,0.2)"</span> <span class="token punctuation">,</span> borderColor <span class="token punctuation">:</span> <span class="token string">"rgba(179,181,198,1)"</span> <span class="token punctuation">,</span> pointBackgroundColor <span class="token punctuation">:</span> <span class="token string">"rgba(179,181,198,1)"</span> <span class="token punctuation">,</span> pointBorderColor <span class="token punctuation">:</span> <span class="token string">"#fff"</span> <span class="token punctuation">,</span> pointHoverBackgroundColor <span class="token punctuation">:</span> <span class="token string">"#fff"</span> <span class="token punctuation">,</span> pointHoverBorderColor <span class="token punctuation">:</span> <span class="token string">"rgba(179,181,198,1)"</span> <span class="token punctuation">,</span> data <span class="token punctuation">:</span> <span class="token punctuation">[</span> <span class="token number">65</span> <span class="token punctuation">,</span> <span class="token number">59</span> <span class="token punctuation">,</span> <span class="token number">90</span> <span class="token punctuation">,</span> <span class="token number">81</span> <span class="token punctuation">,</span> <span class="token number">56</span> <span class="token punctuation">,</span> <span class="token number">55</span> <span class="token punctuation">,</span> <span class="token number">40</span> <span class="token punctuation">]</span> <span class="token punctuation">}</span> <span class="token punctuation">,</span> <span class="token punctuation">{</span> label <span class="token punctuation">:</span> <span class="token string">"My Second dataset"</span> <span class="token punctuation">,</span> backgroundColor <span class="token punctuation">:</span> <span class="token string">"rgba(255,99,132,0.2)"</span> <span class="token punctuation">,</span> borderColor <span class="token punctuation">:</span> <span class="token string">"rgba(255,99,132,1)"</span> <span class="token punctuation">,</span> pointBackgroundColor <span class="token punctuation">:</span> <span class="token string">"rgba(255,99,132,1)"</span> <span class="token punctuation">,</span> pointBorderColor <span class="token punctuation">:</span> <span class="token string">"#fff"</span> <span class="token punctuation">,</span> pointHoverBackgroundColor <span class="token punctuation">:</span> <span class="token string">"#fff"</span> <span class="token punctuation">,</span> pointHoverBorderColor <span class="token punctuation">:</span> <span class="token string">"rgba(255,99,132,1)"</span> <span class="token punctuation">,</span> data <span class="token punctuation">:</span> <span class="token punctuation">[</span> <span class="token number">28</span> <span class="token punctuation">,</span> <span class="token number">48</span> <span class="token punctuation">,</span> <span class="token number">40</span> <span class="token punctuation">,</span> <span class="token number">19</span> <span class="token punctuation">,</span> <span class="token number">96</span> <span class="token punctuation">,</span> <span class="token number">27</span> <span class="token punctuation">,</span> <span class="token number">100</span> <span class="token punctuation">]</span> <span class="token punctuation">}</span> <span class="token punctuation">]</span> <span class="token punctuation">}</span> <span class="token punctuation">,</span> <span class="token punctuation">{</span> responsive <span class="token punctuation">:</span> <span class="token boolean">true</span> <span class="token punctuation">,</span> maintainAspectRatio <span class="token punctuation">:</span> <span class="token boolean">false</span> <span class="token punctuation">}</span> <span class="token punctuation">)</span> <span class="token punctuation">;</span> <span class="token punctuation">}</span> <span class="token punctuation">}</span> <span class="token punctuation">;</span> <span class="token operator"><</span> <span class="token operator">/</span> script <span class="token operator">></span> |
Result: 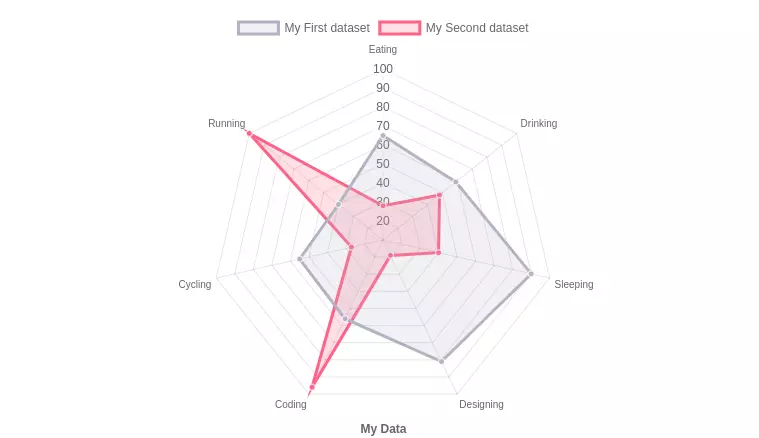
Conclude
Through a few of the sharing above, although not complete and complete, but also a part to help you understand the Vue Chart package. Hoping to help you can apply it in your project. Thank you for reading my article.
