For Performance Testing, evaluating and analyzing the report after running the test is not a simple task, no matter how cool the tool is, showing the report in detail in the end, The test person must still be a reader to understand and draw conclusions for that report. JMeter is no exception, JMeter’s report is full of necessary information, but how to understand? We will have an overview of the parameters of the report and can be applied to evaluate the status of the system after testing.
We will focus on one of JMeter’s useful Reports, which are Aggregate Reports.
1. The figures in the report
We can see that the Aggregate Report is a table report, with 12 columns corresponding to 12 parameters. We will find out what the meaning of each parameter is
• Label: Displays the name of each request included in the test plan
By default, all requests with the same name in the test plan will only display a single line in this table, regardless of whether the content of the requests is different or different from the Thread Group. So when naming requests, keep this in mind, and give them different names. Refer to the image below:
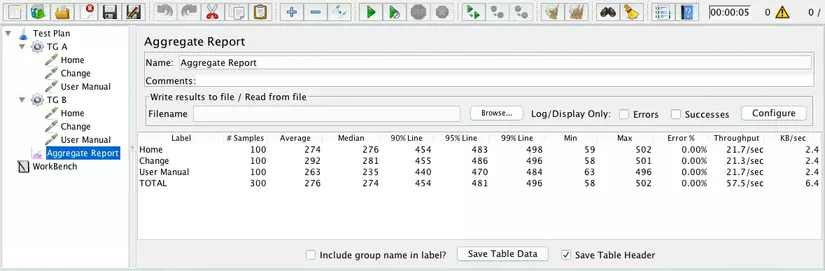
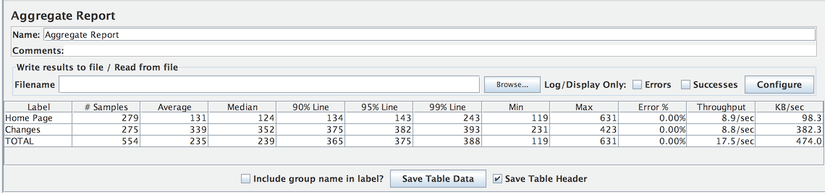
“Include group name in the label?” is UNCHECKED by default
If you select “Include group name in the label?” is checked, the requests will be prefixed with = the name of the Thread Group that contains the request. Refer to the image below:
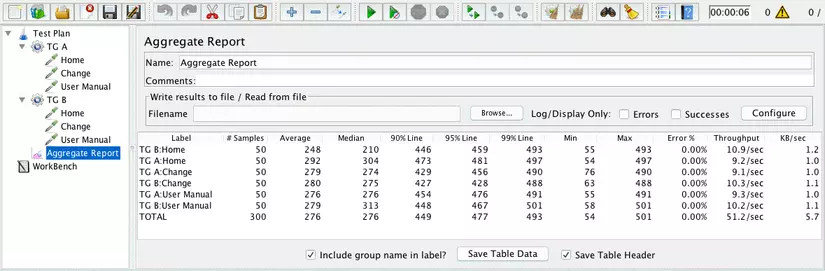
“Include group name in the label?” is CHECKED
• # Samples: The total number of times the request has been run. Formula: # Samples = Number of Threads (users) * Loop Count Example 1: Thread Group with configuration – Number of Threads (users): 10 – Loop Count: 3 Then 1 HTTP Request of this Thread Group will run 10 x 3 = 30 (times) -> # Samples: 30
However, the above formula will not be true in some cases: that is when your Request is under a certain Logic Controller, such as the Logic Controller, such as Loop Controller, Once Only Controller, While Controller, etc. .. Example 2: Continue with example 1 above, but this time put HTTP Request into a Logic Controller, which is a Loop Controller, and set the Loop Count value for this controller to 2. Now your request will be run: 10 x 3 x 2 = 60 (times). -> # Samples: 60
• Average (millisecond): The average response time (Response Time) of the request, counting until the last run.
Example 3: A Request A run totals 4 times with corresponding Response Time results of 101ms, 106ms, 153ms, and 128ms. The average Response Time of Request A will be 122ms (The formula for calculating the average value should not need me to repeat again.)
• Min (millisecond): The lowest response time of the request is calculated for all runs.
In example 3 above, Min = 101ms
• Max (millisecond): The highest response time of the request is calculated for all runs.
In example 3 above, Max = 153ms
• Percentiles (millisecond): Put simply, Percentiles will be a number x, and accompanied by 1 value A. That means that x% will have a value lower than the value of A, the remaining (100-x) % will have a value greater than value A.
Take 1 simple example. After a class test, the teacher said that 90th Percentile got a score of 6. That means that 90% of the class’s score will be below 6 points, and the remaining 10% will be 6 points higher. Or another example, after taking a competency assessment to pv into a company, it is reported that your score with Percentile is: 74%. This means that of all those who took this test, 74% of people scored lower than you, and the remaining 26% had higher scores than you. • Median (millisecond): It is similar to the average, but the meaning is completely different. Median + one value A, will divide all your values into 2 equal parts, one part will contain values <A, the other part will contain values> A. Median is also understood as 50th Percentile. Back at Performance, Median will show that 50% of requests have a response time smaller than the value (shown on the table), and the remaining 50% of requests have a response time greater than this value. • 90% of Line ( 90th Percentile) (millisecond): meaning that 90% of requests will have a response time smaller than the value shown in the table, the remaining 10% will have a response time greater than the value displayed in the table • 95% Line (90th Percentile (millisecond): means that 95% of requests will have a response time smaller than the value shown in the table, the remaining 5% will have a response time greater than the value displayed in the table • 99% Line (90th Percentile) ) (millisecond): means that 99% of requests will have a response time smaller than the value shown in the table, 1% of requests will have a response time greater than the value shown in table 3, for percentile 90th, 95th and 99th are very common parameters used in percentile, not only in Performance Testing but also in other fields. And these numbers are fully configurable in JMeter through the file jmeter.properties, from version 2.12. Open this file from / JMETER_HOME / bin / folder and navigate to the following line:
1 2 3 4 5 6 7 8 9 10 11 12 13 14 15 | CODE: SELECT ALL #--------------------------------------------------------------------------- # Aggregate Report and Aggregate Graph - configuration #--------------------------------------------------------------------------- # # Percentiles to display in reports # Can be float value between 0 and 100 # First percentile to display, defaults to 90% #aggregate_rpt_pct1=90 # Second percentile to display, defaults to 95% #aggregate_rpt_pct2=95 # Second percentile to display, defaults to 99% #aggregate_rpt_pct3=99 |
Then uncomment the aggregate_rpt_pct1, aggregate_rpt_pct2 or aggregate_rpt_pct3 values by removing the # at the beginning, and correcting them with the desired value. Like me, I edited aggregate_rpt_pct1 = 75, then saved the file, restarted JMeter, let’s see how it will display:
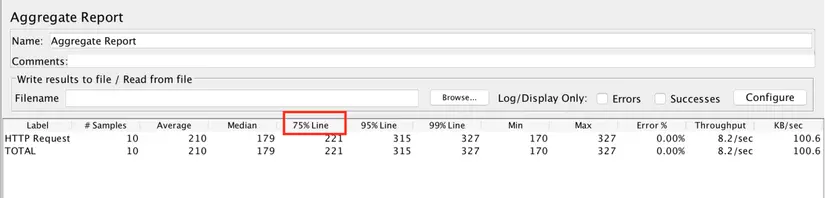
Note: change this value, it will change the label of the header in the report, and also recalculate to the correct new number.
• Error%:% of requests have failed. For example, you run request A 100 times and see 15% errors, which means request A has failed / error 15 times (100 * 15%)
• Throughput: Throughput. This number tells you how many requests the system (server) processes in a unit of time, be it seconds, minutes, or hours. The formula for calculating throughput is Throughput = (Total number of requests) / (Total time) * (Unit of conversion) With:
- Total number of requests = The total number of times this request was run
- Total time = (Start time of the last request) + (Run time / Response Time of the last request) – (Start time of the first request)
- Unit conversion: By default it will be in milliseconds, so if you want to change to second then this number will be 1000, or 1000 * 60 if you want to convert to minutes.
Example 4: I will run 1 test with 5 threads and 2 times the Loop Count, this test only has 1 HTTP Request and access to google. See results below
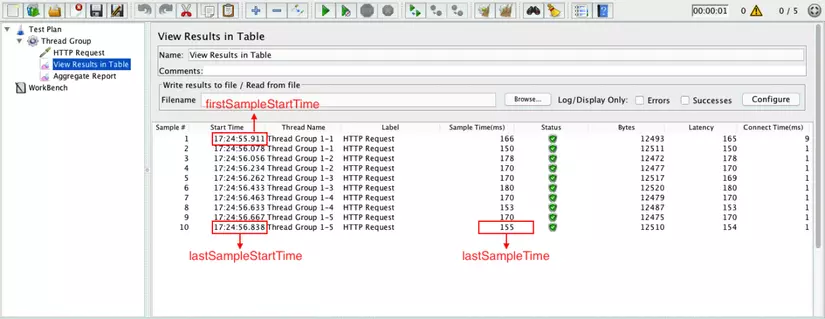
In this test, I used another listener that is View Result in Table to be able to see the parameters of start time and response time as quickly as possible.
Start time of the first request: 17: 24: 55.911 (1476095095911 in ms) Start time of the last request: 17: 24: 56.838 (1476095096838 in ms) Run time / Response Time of the last request : 155ms Total time = (1476095096838 + 155 – 1476095095911) = 1082 Total requests = 10
Throughput = 10/1082 * 1000 ≈ 9.2 / sec
Note: For JMeter it always shows Throughput> 1.0, so in some cases this number <1.0 will convert it to another unit for display. For example 0.5 requests / second, 0.5 does not meet the conditions, so it will display as 30requests / min. It’s the same way, isn’t it. But if you write the output to a CSV file, the throughput number is always in the request / second format, so in this case it will show as 0.5.
• KB / sec: It is also throughput, but not measured by the number of requests, but measured by Kilobytes / second. The formula is Throughput KB / sec = (Throughput * Average Bytes) / 1024 With the Aggregate Report, I can’t see the Average Bytes parameter. You can view this parameter from the Summay Report.
• Total: In the report there is a final line that is Total, it will summarize the entire result from the above requests. Except for # Samples, Throughput and KB / sec, it will be added up in the true sense of “Total”. The remaining parameters are calculated Total by taking the average value from all the above requests.
2. Report Analysis:
After reading Part 1 above, at least you have had an overview of the parameters in the report. What is the meaning of each parameter. In the next step, look at those numbers and give an appropriate rating.
Let’s focus on the 2 most important parameters of every Performance Report:
Response Time: Indicates the processing of FAST or SLOW requests. And of course, the Response Time must be as LOW as possible. Throughput: shows the number of requests processed by the server in a unit of time. So, at the same time, the more you can handle it, the better. So with Throughput, it has to be HIGHer the better
Based on that, we have the following cases:
- Response Time: LOW and Throughput: LOW -> This case will never happen. Because LOW Response Time means a very quick response time, but LOW Throughput indicates that the number of requests processed is very small. Noooo, this is ridiculous
- Response Time: LOW and Throughput: HIGH -> This is an ideal result, isn’t it? The processing time is low and the number of concurrent requests is high. What are you waiting without confidently report that the Server is very good. Consider scaling up the features, or increasing the number of tests to find out what the server limit is.
- Response Time: HIGH and Throughput: LOW -> In contrast to the above, this is where your Performance Test has failed. The test indicated that the processing time was too high, and the number of requests processed was very low. Must consider to improve on the server side.
- Response Time: HIGH and Throughput: HIGH -> Pretty sensitive, because you can see Throughput is high, which means the server is working very well, so why is the processing time also high (not good). Perhaps the problem at the moment is from the Client, or specifically from JMeter, maybe your script is not optimized, making the process it takes a lot of time, for example? Check back to make sure you have an accurate test result.