Hi guys, as you all know statistical probability is quite important in data analysis as well as data science because it helps us to better understand the data we have. And I have quite a bit of free time recently, so I re-learn the knowledge of statistical probability and this is the first article in the Series of Statistical Probability with python . Let’s just get started.
Mean, Median, Mode
3 Mean, Median and Mode values are basic concepts in statistical probability, so in this article, I just mentioned how to calculate it, not in detail, everyone.
I will take an example of the following series of numbers to apply to calculate the above 3 values: 1, 3, 4, 4, 8, 4, 9, 15.
Mean
Mean, also known as the average of the numbers, is calculated as follows:
m e a n = first + 3 + 4 + 4 + 8 + 4 + 9 + 15 8 = 6 mean = frac{1 + 3 + 4 + 4+8+ 4+9+15}{8 } = 6
So the mean of the above series is 6
Median
Median is also known as the median (the middle position). To find the median of the above sequence we do the following:
Sort the above sequence in ascending order, 1, 3, 4, 4, 4, 8, 9, 15. Meadian here is exactly 4
Mode
Or is the frequency that occurs the most and the mode here is equal to 4.
Usually Mean will be the most commonly used. However, if you compare mean and median, the mean will usually be affected by extreme observations (very large or very small), while the median is not. Therefore, if the dataset contains extreme observations, the median is often used instead of mean.
Variance, Standard Deviation
Two data sets may have the same mean, median, and mode values, but still differ in other ways. And one of them is Variation.
For example, consider the height of students aged 15-17 years old in two high schools with the same mean, median and mode, but the variation in height of the students is different; Field A has more uniformity (low variability), field B has higher variability. And we can use Variance and Standard Deviation to measure.
Variance is a measure of the dispersion of values in a data set. It measures the deviation of each data point from the mean of the entire data set. Variance indicates the degree of uniformity or heterogeneity of values in a data set. When the variance is low, it means that the values in the data set are close to each other and do not differ much. Conversely, when the variance is high, the values in the data set have large differences. The formula for calculating Variance is as follows:
σ 2 = first WOMEN ∑ i = first WOMEN ( X i − μ ) 2 begin{array}{l}sigma^2 =frac{1}{N}sum_{i=1}^{N}(X_i-mu)^2end{array}
σ sigma
= Variance population
N = Number of observations in the population
Xi = The i-th observation in the population
μ = Population mean
Standard deviation, also known as standard deviation, is calculated from the variance and tells you how far each value lies from the mean. That’s the square root of variance:
σ = first WOMEN ∑ i = first WOMEN ( X i − μ ) 2 begin{array}{l}sigma =sqrt{frac{1}{N}sum_{i=1}^{N}(X_i-mu)^2}end{array}
σ= Population standard deviation
Apply with Python
The basic knowledge about statistical probability above we have all learned in school, so next we will use python to see if the calculation of the above values is simple.
This week’s data set in the Statistics course is taken from here, everyone can download it for practice.
1 2 3 4 | <span class="token keyword">import</span> numpy <span class="token keyword">as</span> np <span class="token keyword">import</span> pandas <span class="token keyword">as</span> pd <span class="token keyword">import</span> matplotlib <span class="token punctuation">.</span> pyplot <span class="token keyword">as</span> plt |
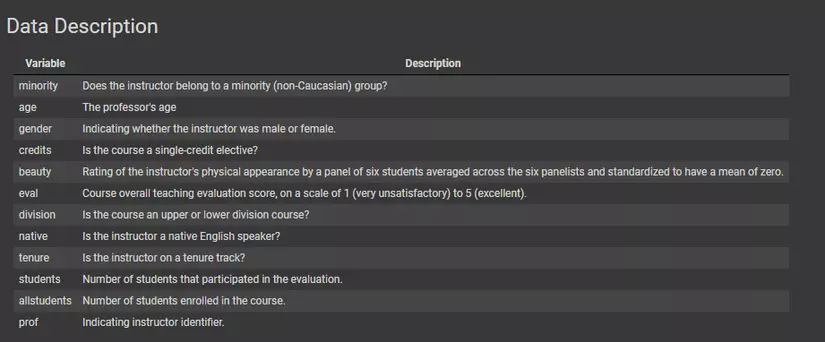
image: description of data
1 2 | ratings_df <span class="token operator">=</span> pd <span class="token punctuation">.</span> read_csv <span class="token punctuation">(</span> <span class="token string">'teachingratings.csv'</span> <span class="token punctuation">)</span> |
Check what’s in the data
1 2 | ratings_df <span class="token punctuation">.</span> head <span class="token punctuation">(</span> <span class="token number">5</span> <span class="token punctuation">)</span> |
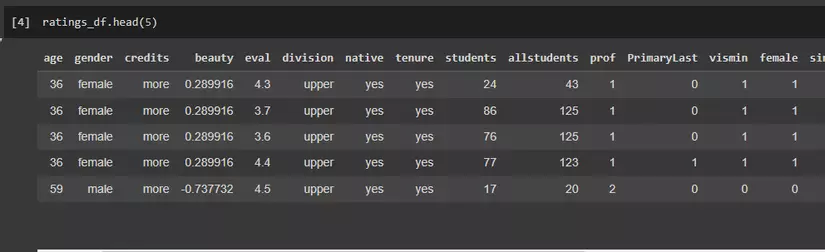
image: first 5 lines of this dataset
check data information
1 2 | ratings_df <span class="token punctuation">.</span> info <span class="token punctuation">(</span> <span class="token punctuation">)</span> |
In python how to calculate Mean, Median, Min, Max? I will calculate these parameters with the ‘Students’ column like the commands below,
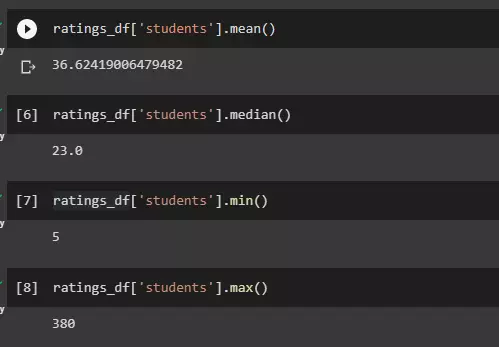
Image: How to calculate mean, mean min, max
In pandas there is a basic and detailed statistical calculation function, let’s see:
1 2 | ratings_df <span class="token punctuation">.</span> describe <span class="token punctuation">(</span> <span class="token punctuation">)</span> |
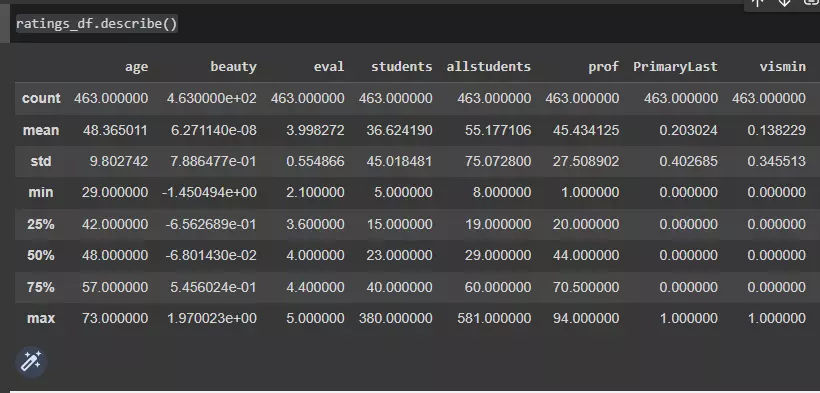
As you can see in the image above, pandas has already calculated the basic values for us in statistics.
Next, we will try to apply the values above to answer these questions.
- Does average beauty score differ by gender? Produce the means and standard deviations for both male and female instructors
1 2 | ratings_df <span class="token punctuation">.</span> groupby <span class="token punctuation">(</span> <span class="token string">'gender'</span> <span class="token punctuation">)</span> <span class="token punctuation">.</span> agg <span class="token punctuation">(</span> <span class="token punctuation">{</span> <span class="token string">'beauty'</span> <span class="token punctuation">:</span> <span class="token punctuation">[</span> <span class="token string">'mean'</span> <span class="token punctuation">,</span> <span class="token string">'std'</span> <span class="token punctuation">,</span> <span class="token string">'var'</span> <span class="token punctuation">]</span> <span class="token punctuation">}</span> <span class="token punctuation">)</span> <span class="token punctuation">.</span> reset_index <span class="token punctuation">(</span> <span class="token punctuation">)</span> |
results:
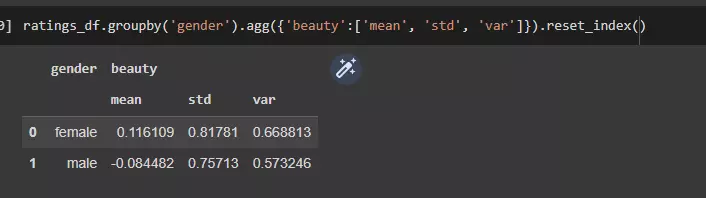
Based on the above results, we can see that the average beauty value of women is higher than that of men
- Calculate the percentage of males and females that are tenured professors. Will you say that tenure status differ by gender?
1 2 3 4 5 6 | <span class="token comment"># groupby and get total sum</span> tenure_count <span class="token operator">=</span> ratings_df <span class="token punctuation">[</span> ratings_df <span class="token punctuation">.</span> tenure <span class="token operator">==</span> <span class="token string">'yes'</span> <span class="token punctuation">]</span> <span class="token punctuation">.</span> groupby <span class="token punctuation">(</span> <span class="token string">'gender'</span> <span class="token punctuation">)</span> <span class="token punctuation">.</span> agg <span class="token punctuation">(</span> <span class="token punctuation">{</span> <span class="token string">'tenure'</span> <span class="token punctuation">:</span> <span class="token string">'count'</span> <span class="token punctuation">}</span> <span class="token punctuation">)</span> <span class="token punctuation">.</span> reset_index <span class="token punctuation">(</span> <span class="token punctuation">)</span> <span class="token comment"># calculate percentage</span> tenure_count <span class="token punctuation">[</span> <span class="token string">'percentage'</span> <span class="token punctuation">]</span> <span class="token operator">=</span> <span class="token number">100</span> <span class="token operator">*</span> tenure_count <span class="token punctuation">.</span> tenure <span class="token operator">/</span> tenure_count <span class="token punctuation">.</span> tenure <span class="token punctuation">.</span> <span class="token builtin">sum</span> <span class="token punctuation">(</span> <span class="token punctuation">)</span> tenure_count |
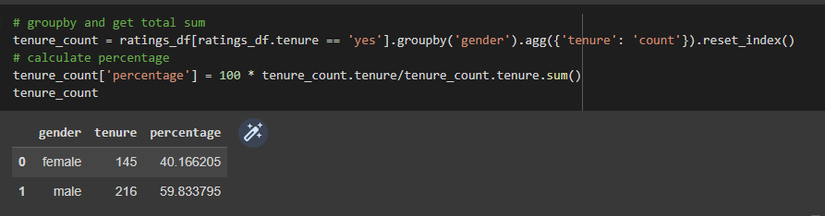
Based on the results, we can also see the difference.
- Calculate the percentage of visible numbers are tenure professors. Will you say that tenure status differed if teacher was a visible minority?
1 2 3 4 5 6 | <span class="token comment"># first groupby to get the total sum</span> tenure_count <span class="token operator">=</span> ratings_df <span class="token punctuation">.</span> groupby <span class="token punctuation">(</span> <span class="token string">'minority'</span> <span class="token punctuation">)</span> <span class="token punctuation">.</span> agg <span class="token punctuation">(</span> <span class="token punctuation">{</span> <span class="token string">'tenure'</span> <span class="token punctuation">:</span> <span class="token string">'count'</span> <span class="token punctuation">}</span> <span class="token punctuation">)</span> <span class="token punctuation">.</span> reset_index <span class="token punctuation">(</span> <span class="token punctuation">)</span> <span class="token comment"># Find the percentage</span> tenure_count <span class="token punctuation">[</span> <span class="token string">'percentage'</span> <span class="token punctuation">]</span> <span class="token operator">=</span> <span class="token number">100</span> <span class="token operator">*</span> tenure_count <span class="token punctuation">.</span> tenure <span class="token operator">/</span> tenure_count <span class="token punctuation">.</span> tenure <span class="token punctuation">.</span> <span class="token builtin">sum</span> <span class="token punctuation">(</span> <span class="token punctuation">)</span> tenure_count |
- *Does average age differ by tenure? Produce the means and standard deviations for both tenured and untenured professors.
This 4th sentence, everyone try the code to see. See the answer in this notebook .
In fact, the course question also suggests which values to use for calculations.
Conclude
Thank you for reading my article, you can study this course with me to exchange, I hope to receive everyone’s suggestions. And don’t forget Upvoted)
Reference
https://www.coursera.org/learn/statistics-for-data-science-python