If you are a RoR programmer, you must be familiar with terms like Unit test, BDD, or RSpec. Today I will not go into each of the above terms, but will introduce you to a great tool for those who have written RSpec, projects that have used RSpec to run tests in their CI pipeline – that is TestProf. Surely you have also seen projects that have a huge amount of RSpec code and run a lot of time, right, and you probably had the thought of wanting to smash all that RSpec code to write. From the beginning, hopefully its running speed will be better, but sometimes your project is busy and you don’t have time to do it, and you don’t know the core cause of RSpec. Your project is slow to come from. My introduction today will help you overcome all the difficulties with TestProf.
Introduction to TestProf
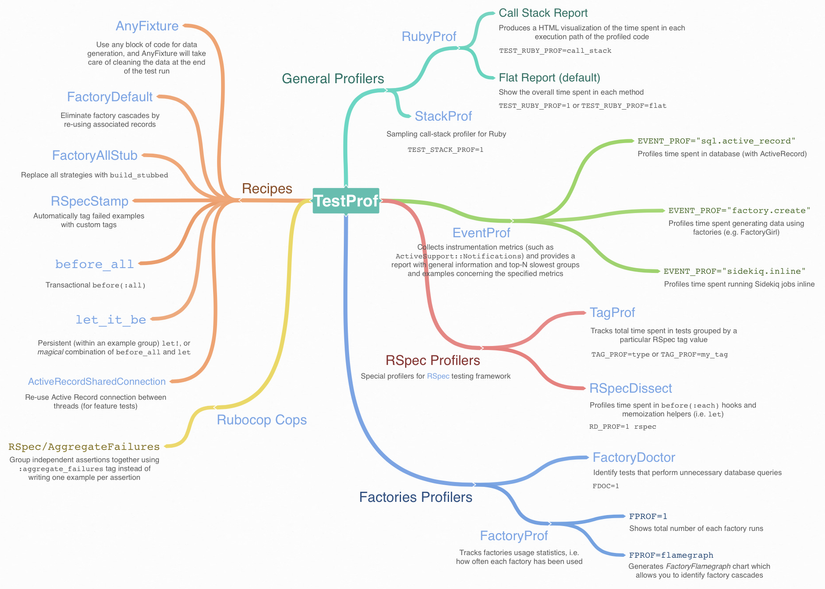
TestProf is a collection of RSpec performance analysis tools in a single gem that helps you find the core reason why your RSpec is slow by providing:
- A convenient method to run the ruby profiler with the
ruby-profgem, all you need is to install theruby-profgem and use thetest-prof‘s builttest-profwithout having to fix too much code. - Factories use analysis tool to generate test data is effective or not.
- Event profile – analyze what test run times are typically used.
Along with such great analysis tools, test-prof also makes recipes, or can be called, replacement helper to improve our RSpec code, helping them run faster without having to. Excessive modification of the existing code structure. The figure below summarizes all the tools that test-prof offers. In addition, test-prof also supports performance analysis for Minitest, very convenient for projects that write unit tests without using RSpec.
To install test-prof , we only need to declare in Gemfile:
1 2 3 4 | group <span class="token symbol">:test</span> <span class="token keyword">do</span> gem <span class="token string">"test-prof"</span> <span class="token keyword">end</span> |
In the next section, we will go into detail about the tools mentioned above.
Exploit information by type of test case
Finding out right away the cause of RSpec’s underperformance is very difficult, the first thing to do is to determine which part of the test cases we are writing takes up the most runtime .
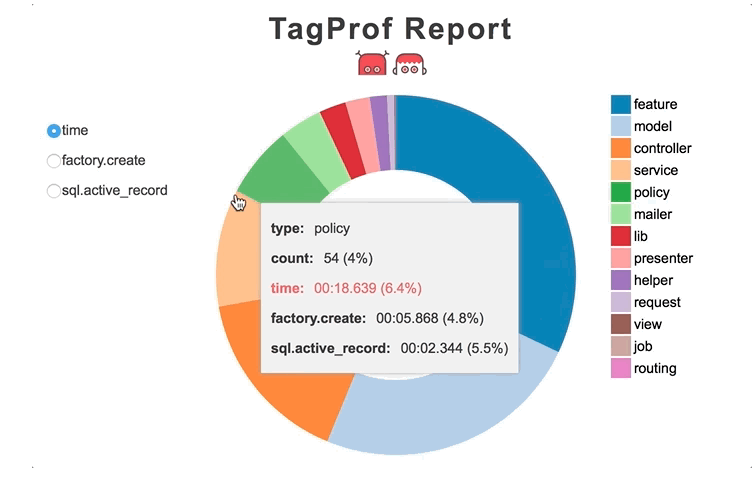
To answer that question, we will use the Tag Profiler (TagProf) of test-prof , TagProf is a simple profiler that collects RSpec runtime performance of test case types classified by their tag. Normally, rspec-rails will automatically divide the test cases by the default tag by controller, model, helper …. When writing tests, we must also assign tags to them by default without notice.
For example:
1 2 3 4 5 6 7 8 9 10 | <span class="token comment"># loại test với tag model</span> <span class="token constant">RSpec</span> <span class="token punctuation">.</span> describe <span class="token constant">Admin</span> <span class="token punctuation">,</span> type <span class="token punctuation">:</span> <span class="token symbol">:model</span> <span class="token keyword">do</span> <span class="token punctuation">.</span> <span class="token punctuation">.</span> <span class="token punctuation">.</span> <span class="token keyword">end</span> <span class="token comment"># loại test với tag controller</span> <span class="token constant">RSpec</span> <span class="token punctuation">.</span> describe <span class="token constant">AdminsController</span> <span class="token punctuation">,</span> type <span class="token punctuation">:</span> <span class="token symbol">:controller</span> <span class="token keyword">do</span> <span class="token punctuation">.</span> <span class="token punctuation">.</span> <span class="token punctuation">.</span> <span class="token keyword">end</span> |
With TagProf, we can know the information about the runtime of each test type, what percentage of the total run time, how many test cases for each type of test, and how many percent of the total. Test case, what is the average time to run a case. All we have to do is set the environment variable before we run rspec:
1 2 3 | <span class="token operator">/</span> <span class="token operator">/</span> định nghĩa chạy rspec phân loại theo type $ <span class="token constant">TAG_PROF</span> <span class="token operator">=</span> type bundle exec rspec |
We can obtain the following result:
1 2 3 4 5 6 7 8 | <span class="token punctuation">[</span> <span class="token constant">TEST</span> <span class="token constant">PROF</span> <span class="token constant">INFO</span> <span class="token punctuation">]</span> <span class="token constant">TagProf</span> report <span class="token keyword">for</span> type type time total <span class="token operator">%</span> total <span class="token operator">%</span> time avg request <span class="token number">00</span> <span class="token punctuation">:</span> <span class="token number">04.808</span> <span class="token number">42</span> <span class="token number">33.87</span> <span class="token number">54.70</span> <span class="token number">00</span> <span class="token punctuation">:</span> <span class="token number">00.114</span> controller <span class="token number">00</span> <span class="token punctuation">:</span> <span class="token number">02.855</span> <span class="token number">42</span> <span class="token number">33.87</span> <span class="token number">32.48</span> <span class="token number">00</span> <span class="token punctuation">:</span> <span class="token number">00.067</span> model <span class="token number">00</span> <span class="token punctuation">:</span> <span class="token number">01.127</span> <span class="token number">40</span> <span class="token number">32.26</span> <span class="token number">12.82</span> <span class="token number">00</span> <span class="token punctuation">:</span> <span class="token number">00.028</span> |
Note that in the above example, we use the classification by type , we can define the test run by another tag, for example the function such as:
1 2 3 4 5 6 7 8 9 10 | <span class="token comment"># test liên quan đến chức năng đăng nhập admin</span> <span class="token constant">RSpec</span> <span class="token punctuation">.</span> describe <span class="token string">""</span> <span class="token punctuation">,</span> function <span class="token punctuation">:</span> <span class="token symbol">:admin_login</span> <span class="token keyword">do</span> <span class="token punctuation">.</span> <span class="token punctuation">.</span> <span class="token punctuation">.</span> <span class="token keyword">end</span> <span class="token comment"># test liên quan đến chức năng quản lý</span> <span class="token constant">RSpec</span> <span class="token punctuation">.</span> describe <span class="token string">""</span> <span class="token punctuation">,</span> function <span class="token punctuation">:</span> <span class="token symbol">:manage</span> <span class="token keyword">do</span> <span class="token punctuation">.</span> <span class="token punctuation">.</span> <span class="token punctuation">.</span> <span class="token keyword">end</span> |
We can also generate a report with a visual html format by running rspec as follows:
1 2 | <span class="token constant">TAG_PROF</span> <span class="token operator">=</span> type <span class="token constant">TAG_PROF_FORMAT</span> <span class="token operator">=</span> html bundle exec rspec |
We can obtain a report file as follows:
Determine which method takes up the most runtime
Once we have identified which components are running slow, we can simply run tests with that type of tag and continue to analyze where the main cause of that test is running slow. This is where ruby-prof shines, of course with the help of test-prof , first of all the ruby-prof integration requires us to declare it in the Gemfile.
1 2 3 4 | group <span class="token symbol">:development</span> <span class="token punctuation">,</span> <span class="token symbol">:test</span> <span class="token keyword">do</span> gem <span class="token string">"ruby-prof"</span> <span class="token punctuation">,</span> <span class="token string">">= 0.17.0"</span> <span class="token punctuation">,</span> <span class="token keyword">require</span> <span class="token punctuation">:</span> <span class="token boolean">false</span> <span class="token keyword">end</span> |
If anyone who has ever used this gem to test the method’s runtime knows to measure such results, we have to manually add code before and after each code, but work with test-prof then we don’t need to do that. ruby-prof can run in two modes, global and per-example, with global mode, we just need to run rspec as follows without having to edit code:
1 2 | <span class="token constant">TEST_RUBY_PROF</span> <span class="token operator">=</span> <span class="token number">1</span> bundle exec rspec <span class="token punctuation">.</span> <span class="token punctuation">.</span> <span class="token punctuation">.</span> |
To run the per-example, we add the shared context option after the examples that need the profile:
1 2 3 4 | it <span class="token string">"is doing heavy stuff"</span> <span class="token punctuation">,</span> <span class="token symbol">:rprof</span> <span class="token keyword">do</span> <span class="token comment"># ...</span> <span class="token keyword">end</span> |
After running, we get the following results, the runtime of each method when running the test is arranged in descending order:
1 2 3 4 5 6 7 8 9 | %self calls name 20.85 721 <Class::BCrypt::Engine>#__bc_crypt 2.31 4690 *ActiveSupport::Notifications::Instrumenter#instrument 1.12 47489 Arel::Visitors::Visitor#dispatch 1.04 205208 String#to_s 0.87 531377 Module#=== 0.87 117109 *Class#new |
In the output file (the path will be printed to the screen after the rspec is finished), there will be detailed explanations about each column in the results above, but here I will give the basic definition:
%selfpercent of the time that method runs on the total time.callsmethod how many times.namemethod name and it is called from class or instance of any class.
ruby-prof can run in two modes, wall and cpu , where wall time measures the actual elapsed time when the method is called, and cpu time measures how long cpu processes that method (i.e. if there is another process processed by cpu, that time will not be recorded in the result). Personally, I find the default wall time more useful because it measures how long we humans have to wait to run rspec. As we can see in the above example, the bc_crypt method is called the least but it takes the most time, allowing us to deduce that the code related to password encryption can slow down the rspec, thereby taking measures to improve it. goodness.
Some common methods can be removed from the profiling list by adding the following config to rails_helper.rb :
1 2 3 4 | <span class="token constant">TestProf</span> <span class="token punctuation">:</span> <span class="token punctuation">:</span> <span class="token constant">RubyProf</span> <span class="token punctuation">.</span> configure <span class="token keyword">do</span> <span class="token operator">|</span> config <span class="token operator">|</span> config <span class="token punctuation">.</span> custom_exclusions <span class="token operator">=</span> <span class="token punctuation">{</span> <span class="token constant">User</span> <span class="token operator">=</span> <span class="token operator">></span> <span class="token string">%i[save save!]</span> <span class="token punctuation">}</span> <span class="token keyword">end</span> |
test-prof default enables the removal of common method, to disable this function we need to add the following config:
1 2 | config <span class="token punctuation">.</span> exclude_common_methods <span class="token operator">=</span> <span class="token boolean">false</span> |
Determine which events take place the most
EventProf is a test-prof tool that collects the most happening events. It works like the notification and instrumentation mechanism of ActiveSupport (if anyone does not know, you can find out here ). It basically works like when we run rspec with the -p option, which will print out 5 or 10 slowest running test suites, but instead we will track one or more events.
test-prof supports all the events that ActiveSupport pre-defined such as sql.active_record , render_template.action_view , … (read more here ). In addition, it also supports a few other custom events such as factory.create (track events that generate data through Factories), sidekiq.inline , sidekiq.jobs (track events related to running sidekiq jobs, inline).
To run EventProf, we also don’t need to edit the code at all (the great thing about test-prof is that we don’t need to edit too much code to run) just run the rspec command like this:
1 2 | <span class="token constant">EVENT_PROF</span> <span class="token operator">=</span> <span class="token string">'sql.active_record'</span> rspec <span class="token punctuation">.</span> <span class="token punctuation">.</span> <span class="token punctuation">.</span> |
We can also measure multiple events by providing a list of events separated by commas , .
1 2 | <span class="token constant">EVENT_PROF</span> <span class="token operator">=</span> <span class="token string">'sql.active_record,perform.active_job'</span> rspec <span class="token punctuation">.</span> <span class="token punctuation">.</span> <span class="token punctuation">.</span> |
We will obtain the following result:
1 2 3 4 5 6 7 8 9 10 11 12 13 14 15 16 17 18 19 | [TEST PROF INFO] EventProf results for sql.active_record Total time: 00:00.256 of 00:00.512 (50.00%) Total events: 1031 Top 5 slowest suites (by time): AnswersController (./spec/controllers/answers_controller_spec.rb:3) – 00:00.119 (549 / 20) of 00:00.200 (59.50%) QuestionsController (./spec/controllers/questions_controller_spec.rb:3) – 00:00.105 (360 / 18) of 00:00.125 (84.00%) CommentsController (./spec/controllers/comments_controller_spec.rb:3) – 00:00.032 (122 / 4) of 00:00.064 (50.00%) Top 5 slowest tests (by time): destroys question (./spec/controllers/questions_controller_spec.rb:38) – 00:00.022 (29) of 00:00.064 (34.38%) change comments count (./spec/controllers/comments_controller_spec.rb:7) – 00:00.011 (34) of 00:00.022 (50.00%) change Votes count (./spec/shared_examples/controllers/voted_examples.rb:23) – 00:00.008 (25) of 00:00.022 (36.36%) change Votes count (./spec/shared_examples/controllers/voted_examples.rb:23) – 00:00.008 (32) of 00:00.035 (22.86%) fails (./spec/shared_examples/controllers/invalid_examples.rb:3) – 00:00.007 (34) of 00:00.014 (50.00%) |
The results include information such as, the runtime of the event on the total time, the number of times the event occurred, and the slowest test suites and test cases.
By default, EventProf collects parameters based on test suite, if you want EventProf to crawl on each example, we need a config like this:
1 2 3 4 | <span class="token constant">TestProf</span> <span class="token punctuation">:</span> <span class="token punctuation">:</span> <span class="token constant">EventProf</span> <span class="token punctuation">.</span> configure <span class="token keyword">do</span> <span class="token operator">|</span> config <span class="token operator">|</span> config <span class="token punctuation">.</span> per_example <span class="token operator">=</span> <span class="token boolean">true</span> <span class="token keyword">end</span> |
Or add variable EVENT_PROF_EXAMPLES=1 .
Now that we have learned some ways to gather information about RSpec performance, you can now partly find out what is the cause of your project’s current test cases slowdown. I will spend analyzing performance of creating test data, recipes improving test case in another part.
The article is referenced at:
https://test-prof.evilmartians.io/#/ https://evilmartians.com/chronicles/testprof-a-good-doctor-for-slow-ruby-tests https://guides.rubyonrails.org/active_support_instrumentation .html https://ruby-prof.github.io/