 Whenever we develop some Android apps, the most common thing all developers worry about is the application’s memory usage. This is because if your application is using large memory then you may lose users because most users use low memory devices. Developers try to find each memory leak in the application so they can optimize their apps to be more neat and faster. Also, if you know which objects are using memory at a specific time, then getting rid of memory leaks in your application becomes an easier task.
In this article, we will learn how to use memory heap data to identify memory leaks. So let’s get started.
Source: https://blog.mindorks.com/how-to-use-memory-heap-dumps-data
Introduction to Profiler
In Android Studio, we have something called Profiler that provides information about the CPU, memory, network, and power usage for our application. Profiler shows a graphical representation of our application’s CPU, memory, network and power usage. With the help of this data, we can optimize our source code. But out of the four, that is, the CPU, memory, network and power, the main used by every developer is the Memory Profiler. So, let’s take a look at what a Memory Profiler is and before that, we will explore the reason for memory leaks and then try to identify that with the help of the Memory Profiler.
Problem
The Memory Profiler helps us find memory leaks and memory churns.
A memory leak is an object which becomes inaccessible to the running program but still occupies memory.
But in Java or Kotlin, we have something called the Garbage Collection. When your application is no longer using some objects, garbage collector will release unused memory back to the heap. For the garbage collection process, the JVM will first identify the Garbage Collection Root (GC Root) as an object accessible from outside the heap, such as running threads and local variables. After that, all objects accessible from the Garbage Collection Root are identified and these objects are retained. And finally, the rest of the objects inaccessible from the Garbage Collection Root are considered garbage and they are recycled. 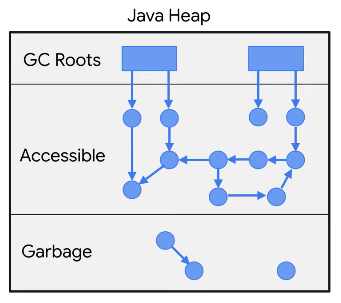 So, where does the concept of Memory Leak come from?
Life was good till we were not introduced with memory leaks.
Memory Leaks works when your object has not been destroyed but at the same time, you are not in a position to use it. So your object will hold memory and you will not be able to use that memory.
In other words, we can say that memory leaks that occur due to abandoned objects can never be used in the program but are accessible.
Solution
To find memory leaks in our application, we can use the memory profiler. To open the memory profiler in our application, follow the steps below:
- Click View> Tool Window> Profiler .
- Run your application on the target device.
- You will see graphs of CPU, memory, network and power usage. Click anywhere on the memory timeline to open the Memory Profiler. The following screen will be opened:

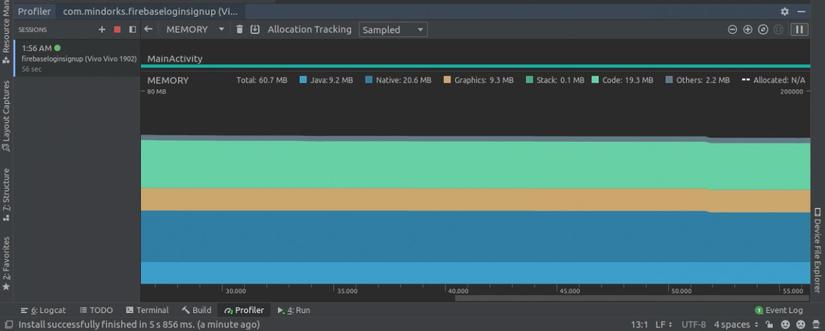
From here, you can avoid memory leaks for two main types of objects, ie Activity and Fragment. We are concerned about this because they often consume a lot of memory. The best thing is that you do not need to detect leaks manually, from Android Studio version 3.6 and above, the memory leaks of Activity and Fragment are detected by Memory Profiler. Because these two classes have a really defined behavior. So how can the profiler say that these classes have leaks?
For Activity, if it was canceled but still referenced, there is a leak. For Fragment, if we don’t see the FragmentManager associated with it and it is still referenced, then it is a leak.
So to identify leaks, due to some Activity or Fragment, the first thing we need to do is capture the heap dump. Let’s see how.
Memory Heap Dump
The Hump Dump is used to find which objects in our application are using memory at the time of heap dump capture. Heap Dump can help us identify memory leaks by displaying objects that are still in memory and that will not be used by the program. By capturing Heap Dump, you can get the following information:
- Memory used by each object.
- Reference of each object is kept in code.
- The type of object allocated by our application.
- Stack calls for where an object is allocated.
To capture a heap dump, you have an option called “Dump Java heap” in the Memory Profiler. Click on it. 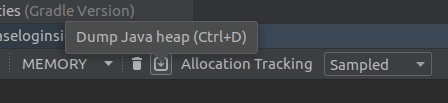
The following screen will be displayed for you: 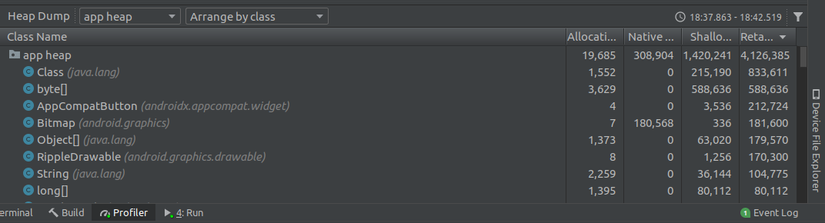 We have a lot of data. There are four classes provided to us:
- Allocations : It shows the number of allocations or instances in the heap.
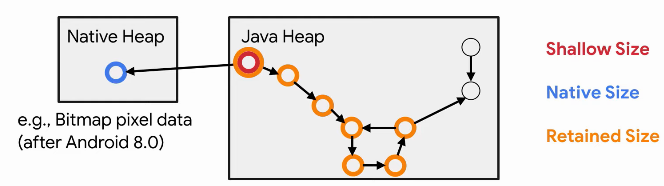
- Native Size : It is the total amount of native memory (in bytes) used by this type of object (only visible for Android 7.0 and above).
- Shallow Size : It is the memory (in bytes) consumed by the object itself.
- Retained Size : It is the memory (in bytes) used by all versions of this class.
So by using this data, you can identify remarkable classes. If you click on any of the class names, then Memory Manager opens the Instance View to display a list of instances of this class. 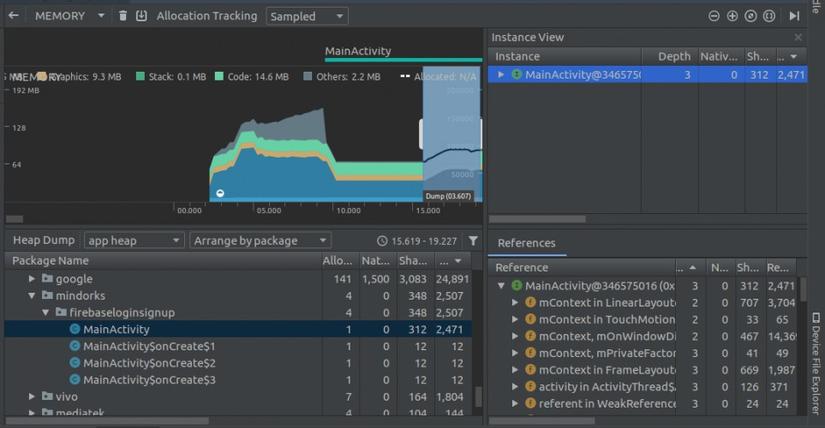
Here, you will find a new data, ie depth. Depth is the shortest number of hops from any Junk Root Collection to the selected instance. The closer an object is to the Garbage Collection, the more likely it is that there are paths from the Root to the object and the lower the chance of it being collected. 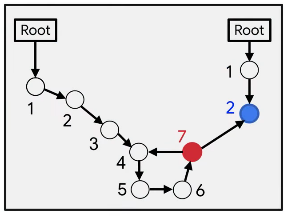
In the example above, for the red button, if any reference to the left is broken, the red button will be inaccessible and it will be garbage collected. But for the green button, if you want to collect trash, then you have to break the path from the left as well as the right.
For example
While using any listener, we must always unregister the listener when not in use because if we don’t do this the listener will be there in the GC Root and it will never be garbage collected. So always try to unregister the listener in the onPause () or onStop () or onDestroy () methods . The following is an example of LocationListener :
1 2 3 4 5 6 7 8 9 10 11 12 13 14 15 16 17 18 19 | <span class="token keyword">public</span> <span class="token keyword">class</span> LocationListenerActivity extends Activity implements LocationUpdate <span class="token punctuation">{</span> <span class="token annotation builtin">@Override</span> <span class="token keyword">public</span> void <span class="token function">onLocationChange</span> <span class="token punctuation">(</span> Location location <span class="token punctuation">)</span> <span class="token punctuation">{</span> <span class="token punctuation">}</span> <span class="token annotation builtin">@Override</span> <span class="token keyword">public</span> void <span class="token function">onStart</span> <span class="token punctuation">(</span> <span class="token punctuation">)</span> <span class="token punctuation">{</span> LocationListener <span class="token punctuation">.</span> <span class="token function">get</span> <span class="token punctuation">(</span> <span class="token punctuation">)</span> <span class="token punctuation">.</span> <span class="token function">register</span> <span class="token punctuation">(</span> <span class="token keyword">this</span> <span class="token punctuation">)</span> <span class="token punctuation">;</span> <span class="token punctuation">}</span> <span class="token annotation builtin">@Override</span> <span class="token keyword">public</span> void <span class="token function">onStop</span> <span class="token punctuation">(</span> <span class="token punctuation">)</span> <span class="token punctuation">{</span> LocationListener <span class="token punctuation">.</span> <span class="token function">get</span> <span class="token punctuation">(</span> <span class="token punctuation">)</span> <span class="token punctuation">.</span> <span class="token function">unregister</span> <span class="token punctuation">(</span> <span class="token keyword">this</span> <span class="token punctuation">)</span> <span class="token punctuation">;</span> <span class="token punctuation">}</span> <span class="token punctuation">}</span> |
If you do not unregister the listener, in the java heap dump, you will see a state that says we are leaking memory due to LocationListener.
That’s how you can use data from the Memory Profiler heap heap to find leaks, then optimize and fix the code for better results.
Hope you learned something new today.