Refer: https://www.blazemeter.com/blog/how-perform-stress-test-jmeter
Think of the following scenario: A system that displays student test results that have been tested using multiple automated function tests. Performance test results are also promising. The system is ready to deploy to production. However, when the test results are published on the system, the server is slowed down and stopped working.
So what happened ??? When the exam results are published, all students want to check the results as soon as possible. They perform simultaneous access to the system so the server cannot process all requests. First, it is slowed down by the database. The server then does not handle the middle tier with data and software that is not prepared for this situation and as a result, it stops running.
So, what did miss test when performing Performance test? That is Stress Testing. In addition to testing the expected number of users, Stress Testing will test the behavior of the system under a heavy load, as well as check how it recovered after returning to normal use. Stress Testing can be done easily with open source testing tools like JMeter.
Choose a test scenario
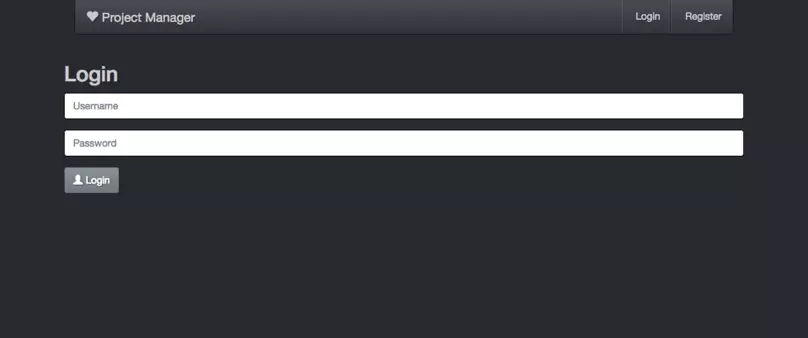
The sample application we will use for testing in this article is a project management tool under development. Currently it has some basic features:
- Log in
- Create a project and link a Github repository to it
- Create Issue in the project
The first step in the stress test is to identify key scenarios. Choose scenarios based on business value (their importance to the success of the project) and user preferences (where users spend most of their time).
In this test, we check the response time for the site’s login page and project details page.
Response time is important because load time is a major contributor to page abandonment. With the increase of internet connection speed, the average user’s patience is going down. If a website, load time more than 4 seconds, about 25% of users will leave.
We chose the login function, which provides access to the database, as this is an important part of every system.
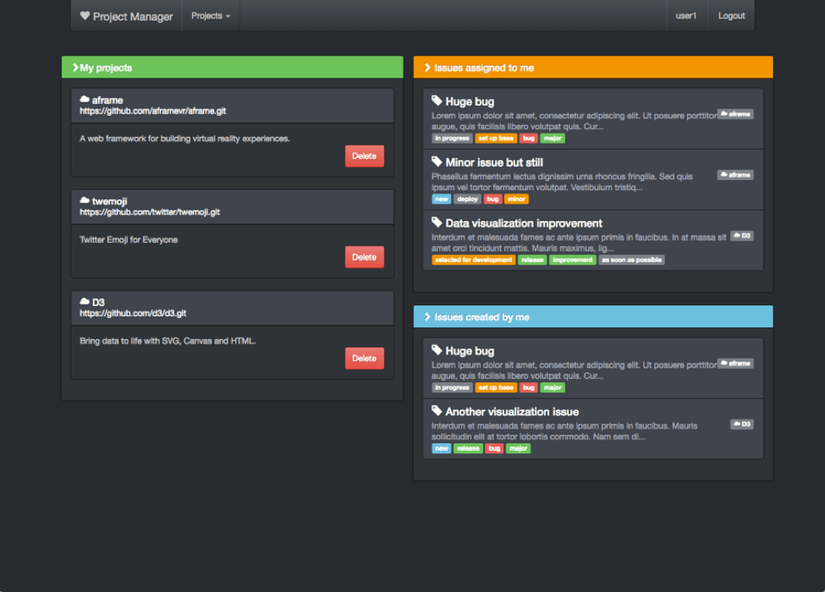
We chose the project details page because in our test system, it read data from multiple tables and we hope users will spend most of their time on that page. Therefore, we want to make sure that the page will load in a reasonable time even when used in excess.
Now that we have identified our test objectives, let’s take a look at the characteristics of the tests: The 1 – Login test case includes:
- Go to the login page
- Enter user information
- Click the Login button
- Wait for a Reply Sign in
Test case 2 – Steps to check the “Project details” page:
- Go to the login page
- Enter user information
- Click the Login button
- Download the Dashboard page
- Click on an existing project
** Create and record test scripts **
After deciding on test cases, we can continue with creating test scripts. The fastest way to create a JMeter test script is Recording. You can use the JMeter recorder or BlazeMeter Chrome Extension, which is free at the Chrome store, and is more user-friendly because you don’t have to set a proxy to use it, like when using Recording in JMeter.
Through your Chrome, start recording and simulating user scenarios that you decide to test. When finished, stop recording.
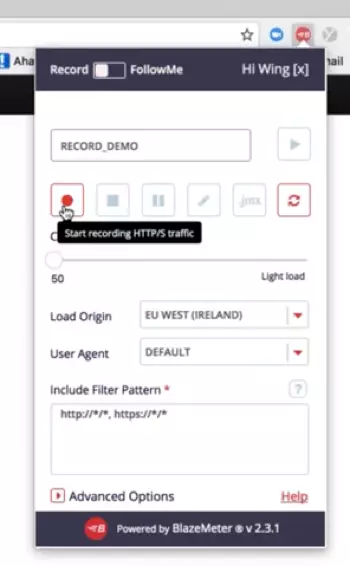
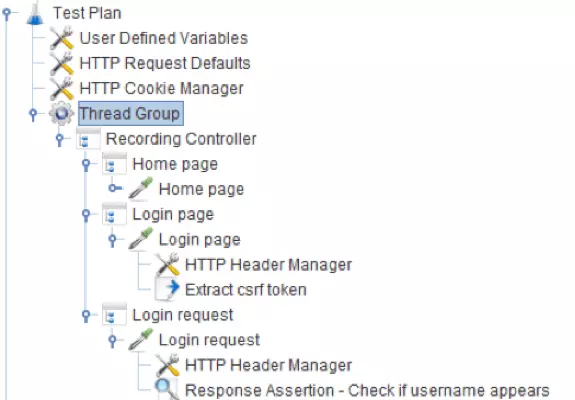
Export the file to jmx and open it in JMeter, where you can edit and configure its parameters.
Configuring Thread Group
Each test has its own configuration, such as csrf tokens, response assertions and timers but the similarity between all Stress Testing is to test the system performance for a large number of users. It is up to your business goals to determine the number of users you are testing.
In this case, we want to emphasize testing with 1,000 users.
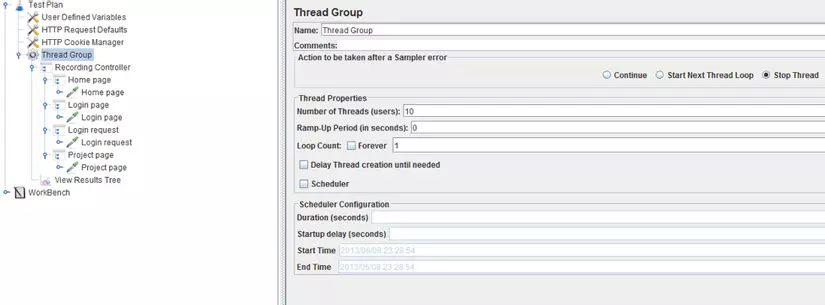
To do that, you need to configure Thread Group. The most important configurations of Thread Group are the number of Threads, Ramp-up time and loop count. The number of Threads set for the number of users simulating, Ramp-up time set for the time for JMeter to start executing all Threads and the loop count is the number of times the test script will be repeated.
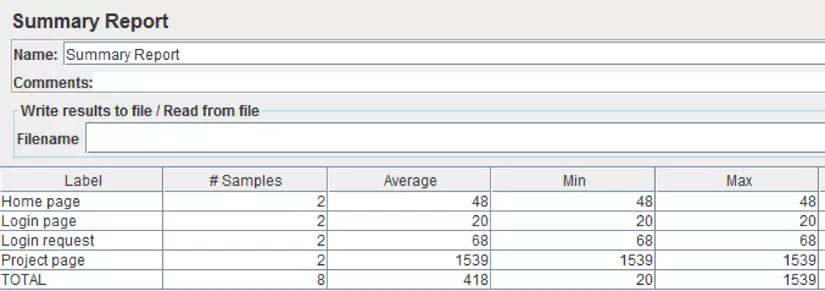
The results show us that the required processing time for the login page: 68 milliseconds and for the project details page: 1539 milliseconds. Therefore, we can conclude that a lot of resources are used during project page loading.
Now, we can start increasing the number of Threads we are testing. We move on to 10 Threads, 0 ramp-ups and 1 loop. Because we are still testing a small number of threads, we can use JMeter in GUI mode and see the test through the listener.
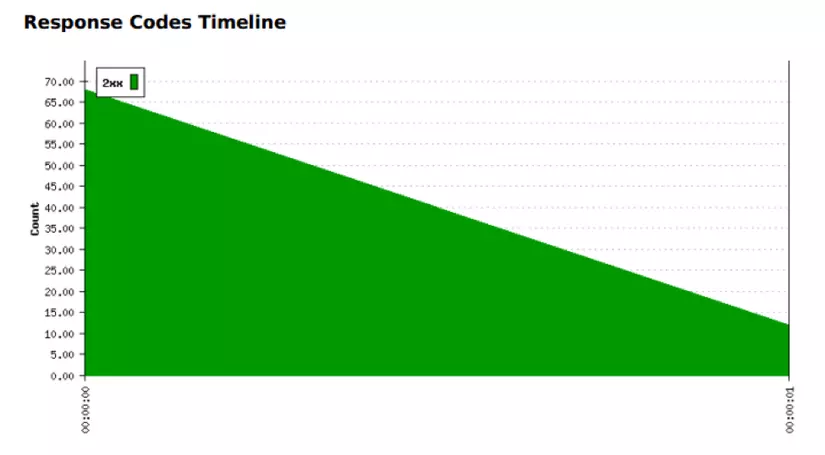
We can see that the system was able to correctly handle all the requests
So now we will increase the number of users to 100 (10% of the target). The only parameter in the script we need to change is the Number of Threads and we can run the script again. Do not forget to delete the listener between runs in the case you are using.
After that, increase the upload to 50% of the target, in our case it is increased to 500 users. Based on the results, we can continue to increase the load (if the test succeeds) or decrease (if there is an error). In case we need to go down, we should find out how many users break the system, so we can decide how to fix the bottlenecks.
If the results are all green for a 500 Threads test, increase the number of Threads for a target of 1000 users. For more accurate results, we recommend that you move the test to the Stepping Thread Group, which you can add from JMeter Add-in Manager.
Stepping Thread Group allows you to configure how many Threads to start, how much should be added over time to reach the maximum, and how long is ramp-down. Due to its ramp-down capability, the Stepping Thread Group is perfect for testing system recovery.
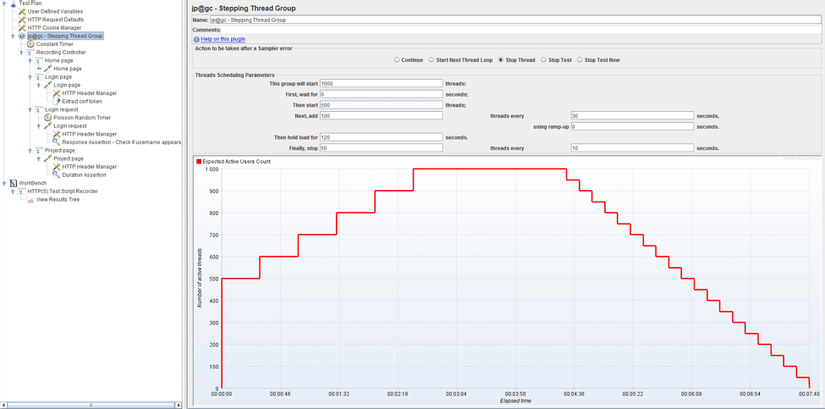
This test starts with 500 Threads that we know the server can handle. We then configured JMeter to increase 100 Threads every 30 seconds. This way, if there’s a problem before achieving our goal, we can find out where it is and what it is. We configured 1,000 Threads to run for 2 minutes (120 seconds). To see how well the system is recovering, there is a down time – every 10 seconds, 50 threads will be stopped.
There is a limit to the number of threads that can be run on a machine during a stress test. But there are some simple ways to increase this number. Try to run JMeter in Non-Guide mode, which is a must in case of a large number of Threads. We should also avoid listener in our test plan to further optimize the test run. If these simple adjustments are not enough, distribute the number of threads between multiple machines. Results may be generated after the test is performed. Of course, you can also use CA BlazeMeter, a type of JMeter on the cloud.
JMeter will provide us with KPIs such as: Response times, throughput and error rate. In addition, we recommend monitoring server performance. CPU usage, memory usage, input / output and database logs are useful parameters for identifying system bottlenecks.
Streess Testing is an important way to ensure your system is error free before deploying. To learn more about load testing, watch the free webinar about getting started with JMeter after 60 minutes or watch the CA BlazeMeter demo.