Introduce
Nowadays, the management websites have become more and more diversified, so the statistical management and reporting is quite common. To make data statistics more intuitive, the chart is one of the great support tools. What is a chart? What are the advantages of graphical representation of data?
A diagram is a graphical representation of data, often used to compare and recognize differences and to know the specific ratio of each component to the whole.
The advantage of representing data with graphs is that it makes it easy to compare data to make a forecast of data trends.
There are many different types of charts and drawing these charts on the website is very easy because there are so many supporting libraries such as ChartJS , Google Charts , Highcharts JS …
What is ChartJS ? Chart.js is an open-source library that supports bar, line, area, pie (radar), radar, polar chart types … ChartJS is responsive by default, making it work on multiple platforms. than. ChartJS is undoubtedly one of the most impressive open source libraries of charts lately.
In this article, I will use ChartJS in combination with PHP, MySQL to display graphs in the most simple way, from which you can customize yourself to make your chart more suitable and beautiful.
Create the database
First we need to create a database to contain the information to create a chart:
1 2 3 4 5 6 7 8 9 10 11 12 13 14 15 16 17 18 | <span class="token keyword">CREATE</span> <span class="token keyword">DATABASE</span> student_chart <span class="token punctuation">;</span> <span class="token keyword">CREATE</span> <span class="token keyword">TABLE</span> student_chart <span class="token punctuation">.</span> graph <span class="token punctuation">(</span> user_id <span class="token keyword">INT</span> <span class="token operator">NOT</span> <span class="token boolean">NULL</span> <span class="token keyword">AUTO_INCREMENT</span> <span class="token punctuation">,</span> name <span class="token keyword">VARCHAR</span> <span class="token punctuation">(</span> <span class="token number">20</span> <span class="token punctuation">)</span> <span class="token operator">NOT</span> <span class="token boolean">NULL</span> <span class="token punctuation">,</span> major <span class="token keyword">VARCHAR</span> <span class="token punctuation">(</span> <span class="token number">40</span> <span class="token punctuation">)</span> <span class="token operator">NOT</span> <span class="token boolean">NULL</span> <span class="token punctuation">,</span> <span class="token keyword">status</span> <span class="token keyword">VARCHAR</span> <span class="token punctuation">(</span> <span class="token number">20</span> <span class="token punctuation">)</span> <span class="token operator">NOT</span> <span class="token boolean">NULL</span> <span class="token punctuation">,</span> <span class="token keyword">PRIMARY</span> <span class="token keyword">KEY</span> <span class="token punctuation">(</span> user_id <span class="token punctuation">)</span> <span class="token punctuation">)</span> <span class="token keyword">ENGINE</span> <span class="token operator">=</span> <span class="token keyword">InnoDB</span> <span class="token punctuation">;</span> <span class="token keyword">INSERT</span> <span class="token keyword">INTO</span> graph <span class="token punctuation">(</span> name <span class="token punctuation">,</span> major <span class="token punctuation">,</span> <span class="token keyword">status</span> <span class="token punctuation">)</span> <span class="token keyword">VALUES</span> <span class="token punctuation">(</span> <span class="token string">"Hòa"</span> <span class="token punctuation">,</span> <span class="token string">"An toàn thông tin"</span> <span class="token punctuation">,</span> <span class="token string">"Đồng ý"</span> <span class="token punctuation">)</span> <span class="token punctuation">;</span> <span class="token keyword">INSERT</span> <span class="token keyword">INTO</span> graph <span class="token punctuation">(</span> name <span class="token punctuation">,</span> major <span class="token punctuation">,</span> <span class="token keyword">status</span> <span class="token punctuation">)</span> <span class="token keyword">VALUES</span> <span class="token punctuation">(</span> <span class="token string">"Huy"</span> <span class="token punctuation">,</span> <span class="token string">"Công nghệ thông tin"</span> <span class="token punctuation">,</span> <span class="token string">"Từ chối"</span> <span class="token punctuation">)</span> <span class="token punctuation">;</span> <span class="token keyword">INSERT</span> <span class="token keyword">INTO</span> graph <span class="token punctuation">(</span> name <span class="token punctuation">,</span> major <span class="token punctuation">,</span> <span class="token keyword">status</span> <span class="token punctuation">)</span> <span class="token keyword">VALUES</span> <span class="token punctuation">(</span> <span class="token string">"Hùng"</span> <span class="token punctuation">,</span> <span class="token string">"Điện tử viễn thông"</span> <span class="token punctuation">,</span> <span class="token string">"Đang chờ"</span> <span class="token punctuation">)</span> <span class="token punctuation">;</span> <span class="token keyword">INSERT</span> <span class="token keyword">INTO</span> graph <span class="token punctuation">(</span> name <span class="token punctuation">,</span> major <span class="token punctuation">,</span> <span class="token keyword">status</span> <span class="token punctuation">)</span> <span class="token keyword">VALUES</span> <span class="token punctuation">(</span> <span class="token string">"Hải"</span> <span class="token punctuation">,</span> <span class="token string">"Điện tử viễn thông"</span> <span class="token punctuation">,</span> <span class="token string">"Đồng ý"</span> <span class="token punctuation">)</span> <span class="token punctuation">;</span> <span class="token keyword">INSERT</span> <span class="token keyword">INTO</span> graph <span class="token punctuation">(</span> name <span class="token punctuation">,</span> major <span class="token punctuation">,</span> <span class="token keyword">status</span> <span class="token punctuation">)</span> <span class="token keyword">VALUES</span> <span class="token punctuation">(</span> <span class="token string">"Nam"</span> <span class="token punctuation">,</span> <span class="token string">"Công nghệ thông tin"</span> <span class="token punctuation">,</span> <span class="token string">"Đang chờ"</span> <span class="token punctuation">)</span> <span class="token punctuation">;</span> <span class="token keyword">INSERT</span> <span class="token keyword">INTO</span> graph <span class="token punctuation">(</span> name <span class="token punctuation">,</span> major <span class="token punctuation">,</span> <span class="token keyword">status</span> <span class="token punctuation">)</span> <span class="token keyword">VALUES</span> <span class="token punctuation">(</span> <span class="token string">"Đông"</span> <span class="token punctuation">,</span> <span class="token string">"Điện tử viễn thông"</span> <span class="token punctuation">,</span> <span class="token string">"Đang chờ"</span> <span class="token punctuation">)</span> <span class="token punctuation">;</span> |
Directory structure
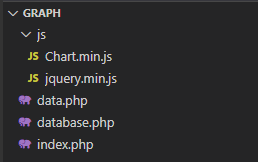
There will be a root directory containing files such as data.php to retrieve data from the server, database.php to connect to the database, file index.php to represent data in the form of charts, and js directory yet. Libraries like jquery and Chart.js.
1. database.php
Next, you need a file to connect to the MySQL database:
1 2 3 4 5 6 7 8 9 10 11 12 | <span class="token php language-php"><span class="token delimiter important"><?php</span> <span class="token variable">$servername</span> <span class="token operator">=</span> <span class="token double-quoted-string string">"localhost"</span> <span class="token punctuation">;</span> <span class="token variable">$username</span> <span class="token operator">=</span> <span class="token double-quoted-string string">"root"</span> <span class="token punctuation">;</span> <span class="token variable">$password</span> <span class="token operator">=</span> <span class="token double-quoted-string string">""</span> <span class="token punctuation">;</span> <span class="token variable">$dbname</span> <span class="token operator">=</span> <span class="token double-quoted-string string">"student_chart"</span> <span class="token punctuation">;</span> <span class="token variable">$conn</span> <span class="token operator">=</span> <span class="token keyword">new</span> <span class="token class-name">PDO</span> <span class="token punctuation">(</span> <span class="token double-quoted-string string">"mysql:host= <span class="token interpolation"><span class="token variable">$servername</span></span> ;dbname= <span class="token interpolation"><span class="token variable">$dbname</span></span> ;"</span> <span class="token punctuation">,</span> <span class="token variable">$username</span> <span class="token punctuation">,</span> <span class="token variable">$password</span> <span class="token punctuation">)</span> <span class="token punctuation">;</span> <span class="token keyword">if</span> <span class="token punctuation">(</span> <span class="token operator">!</span> <span class="token variable">$conn</span> <span class="token punctuation">)</span> <span class="token punctuation">{</span> <span class="token keyword">die</span> <span class="token punctuation">(</span> <span class="token double-quoted-string string">"Connect database failed"</span> <span class="token punctuation">)</span> <span class="token punctuation">;</span> <span class="token punctuation">}</span> <span class="token delimiter important">?></span></span> |
2. data.php
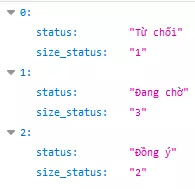
The data.php file will query the table and export the extracted data from the MySQL database and encode as json.
1 2 3 4 5 6 7 8 9 10 11 12 13 14 15 16 17 | <span class="token php language-php"><span class="token delimiter important"><?php</span> <span class="token function">header</span> <span class="token punctuation">(</span> <span class="token single-quoted-string string">'Content-Type: application/json'</span> <span class="token punctuation">)</span> <span class="token punctuation">;</span> <span class="token keyword">require_once</span> <span class="token punctuation">(</span> <span class="token double-quoted-string string">"database.php"</span> <span class="token punctuation">)</span> <span class="token punctuation">;</span> <span class="token variable">$data</span> <span class="token operator">=</span> <span class="token keyword">array</span> <span class="token punctuation">(</span> <span class="token punctuation">)</span> <span class="token punctuation">;</span> <span class="token variable">$query</span> <span class="token operator">=</span> <span class="token double-quoted-string string">"SELECT status, COUNT(status) AS size_status FROM graph GROUP BY status"</span> <span class="token punctuation">;</span> <span class="token variable">$stmt</span> <span class="token operator">=</span> <span class="token variable">$conn</span> <span class="token operator">-</span> <span class="token operator">></span> <span class="token function">prepare</span> <span class="token punctuation">(</span> <span class="token variable">$query</span> <span class="token punctuation">)</span> <span class="token punctuation">;</span> <span class="token keyword">if</span> <span class="token punctuation">(</span> <span class="token variable">$stmt</span> <span class="token operator">-</span> <span class="token operator">></span> <span class="token function">execute</span> <span class="token punctuation">(</span> <span class="token punctuation">)</span> <span class="token punctuation">)</span> <span class="token punctuation">{</span> <span class="token keyword">if</span> <span class="token punctuation">(</span> <span class="token variable">$stmt</span> <span class="token operator">-</span> <span class="token operator">></span> <span class="token function">rowCount</span> <span class="token punctuation">(</span> <span class="token punctuation">)</span> <span class="token operator">></span> <span class="token number">0</span> <span class="token punctuation">)</span> <span class="token punctuation">{</span> <span class="token variable">$result</span> <span class="token operator">=</span> <span class="token variable">$stmt</span> <span class="token operator">-</span> <span class="token operator">></span> <span class="token function">fetchAll</span> <span class="token punctuation">(</span> <span class="token constant">PDO</span> <span class="token punctuation">:</span> <span class="token punctuation">:</span> <span class="token constant">FETCH_ASSOC</span> <span class="token punctuation">)</span> <span class="token punctuation">;</span> <span class="token punctuation">}</span> <span class="token punctuation">}</span> <span class="token keyword">foreach</span> <span class="token punctuation">(</span> <span class="token variable">$result</span> <span class="token keyword">as</span> <span class="token variable">$row</span> <span class="token punctuation">)</span> <span class="token punctuation">{</span> <span class="token variable">$data</span> <span class="token punctuation">[</span> <span class="token punctuation">]</span> <span class="token operator">=</span> <span class="token variable">$row</span> <span class="token punctuation">;</span> <span class="token punctuation">}</span> <span class="token keyword">echo</span> <span class="token function">json_encode</span> <span class="token punctuation">(</span> <span class="token variable">$data</span> <span class="token punctuation">)</span> <span class="token punctuation">;</span> <span class="token delimiter important">?></span></span> |
To check the results, you can access the link to the file for example: http: //localhost/graph/data.php
3. index.php
1 2 3 4 5 6 7 8 9 10 11 12 13 14 15 16 17 18 19 20 21 22 23 24 25 26 27 28 29 30 31 32 33 34 35 36 37 38 39 40 41 42 43 44 45 46 47 48 49 50 51 52 53 54 55 56 57 58 59 60 61 62 63 64 65 66 67 68 69 70 71 | <span class="token php language-php"><span class="token delimiter important"><?php</span> <span class="token delimiter important">?></span></span> <span class="token doctype"><!DOCTYPE html></span> <span class="token tag"><span class="token tag"><span class="token punctuation"><</span> html</span> <span class="token punctuation">></span></span> <span class="token tag"><span class="token tag"><span class="token punctuation"><</span> head</span> <span class="token punctuation">></span></span> <span class="token tag"><span class="token tag"><span class="token punctuation"><</span> title</span> <span class="token punctuation">></span></span> Tạo biểu đồ sử dụng PHP và Chart.js <span class="token tag"><span class="token tag"><span class="token punctuation"></</span> title</span> <span class="token punctuation">></span></span> <span class="token tag"><span class="token tag"><span class="token punctuation"><</span> style</span> <span class="token attr-name">type</span> <span class="token attr-value"><span class="token punctuation">=</span> <span class="token punctuation">"</span> text/css <span class="token punctuation">"</span></span> <span class="token punctuation">></span></span> <span class="token style"><span class="token language-css"> <span class="token selector">BODY</span> <span class="token punctuation">{</span> <span class="token property">width</span> <span class="token punctuation">:</span> 550PX <span class="token punctuation">;</span> <span class="token punctuation">}</span> <span class="token selector">#chart-container</span> <span class="token punctuation">{</span> <span class="token property">width</span> <span class="token punctuation">:</span> 100% <span class="token punctuation">;</span> <span class="token property">height</span> <span class="token punctuation">:</span> auto <span class="token punctuation">;</span> <span class="token punctuation">}</span> </span></span> <span class="token tag"><span class="token tag"><span class="token punctuation"></</span> style</span> <span class="token punctuation">></span></span> <span class="token tag"><span class="token tag"><span class="token punctuation"><</span> script</span> <span class="token attr-name">type</span> <span class="token attr-value"><span class="token punctuation">=</span> <span class="token punctuation">"</span> text/javascript <span class="token punctuation">"</span></span> <span class="token attr-name">src</span> <span class="token attr-value"><span class="token punctuation">=</span> <span class="token punctuation">"</span> js/jquery.min.js <span class="token punctuation">"</span></span> <span class="token punctuation">></span></span> <span class="token tag"><span class="token tag"><span class="token punctuation"></</span> script</span> <span class="token punctuation">></span></span> <span class="token tag"><span class="token tag"><span class="token punctuation"><</span> script</span> <span class="token attr-name">type</span> <span class="token attr-value"><span class="token punctuation">=</span> <span class="token punctuation">"</span> text/javascript <span class="token punctuation">"</span></span> <span class="token attr-name">src</span> <span class="token attr-value"><span class="token punctuation">=</span> <span class="token punctuation">"</span> js/Chart.min.js <span class="token punctuation">"</span></span> <span class="token punctuation">></span></span> <span class="token tag"><span class="token tag"><span class="token punctuation"></</span> script</span> <span class="token punctuation">></span></span> <span class="token tag"><span class="token tag"><span class="token punctuation"></</span> head</span> <span class="token punctuation">></span></span> <span class="token tag"><span class="token tag"><span class="token punctuation"><</span> body</span> <span class="token punctuation">></span></span> <span class="token tag"><span class="token tag"><span class="token punctuation"><</span> div</span> <span class="token attr-name">id</span> <span class="token attr-value"><span class="token punctuation">=</span> <span class="token punctuation">"</span> chart-container <span class="token punctuation">"</span></span> <span class="token punctuation">></span></span> <span class="token tag"><span class="token tag"><span class="token punctuation"><</span> canvas</span> <span class="token attr-name">id</span> <span class="token attr-value"><span class="token punctuation">=</span> <span class="token punctuation">"</span> graph <span class="token punctuation">"</span></span> <span class="token punctuation">></span></span> <span class="token tag"><span class="token tag"><span class="token punctuation"></</span> canvas</span> <span class="token punctuation">></span></span> <span class="token tag"><span class="token tag"><span class="token punctuation"></</span> div</span> <span class="token punctuation">></span></span> <span class="token tag"><span class="token tag"><span class="token punctuation"><</span> script</span> <span class="token punctuation">></span></span> <span class="token script"><span class="token language-javascript"> <span class="token function">$</span> <span class="token punctuation">(</span> document <span class="token punctuation">)</span> <span class="token punctuation">.</span> <span class="token function">ready</span> <span class="token punctuation">(</span> <span class="token keyword">function</span> <span class="token punctuation">(</span> <span class="token punctuation">)</span> <span class="token punctuation">{</span> <span class="token function">showGraph</span> <span class="token punctuation">(</span> <span class="token punctuation">)</span> <span class="token punctuation">;</span> <span class="token punctuation">}</span> <span class="token punctuation">)</span> <span class="token punctuation">;</span> <span class="token keyword">function</span> <span class="token function">showGraph</span> <span class="token punctuation">(</span> <span class="token punctuation">)</span> <span class="token punctuation">{</span> $ <span class="token punctuation">.</span> <span class="token function">post</span> <span class="token punctuation">(</span> <span class="token string">"data.php"</span> <span class="token punctuation">,</span> <span class="token keyword">function</span> <span class="token punctuation">(</span> <span class="token parameter">data</span> <span class="token punctuation">)</span> <span class="token punctuation">{</span> <span class="token keyword">var</span> labels <span class="token operator">=</span> <span class="token punctuation">[</span> <span class="token punctuation">]</span> <span class="token punctuation">;</span> <span class="token keyword">var</span> result <span class="token operator">=</span> <span class="token punctuation">[</span> <span class="token punctuation">]</span> <span class="token punctuation">;</span> <span class="token keyword">for</span> <span class="token punctuation">(</span> <span class="token keyword">var</span> i <span class="token keyword">in</span> data <span class="token punctuation">)</span> <span class="token punctuation">{</span> labels <span class="token punctuation">.</span> <span class="token function">push</span> <span class="token punctuation">(</span> data <span class="token punctuation">[</span> i <span class="token punctuation">]</span> <span class="token punctuation">.</span> status <span class="token punctuation">)</span> <span class="token punctuation">;</span> result <span class="token punctuation">.</span> <span class="token function">push</span> <span class="token punctuation">(</span> data <span class="token punctuation">[</span> i <span class="token punctuation">]</span> <span class="token punctuation">.</span> size_status <span class="token punctuation">)</span> <span class="token punctuation">;</span> <span class="token punctuation">}</span> <span class="token keyword">var</span> pie <span class="token operator">=</span> <span class="token function">$</span> <span class="token punctuation">(</span> <span class="token string">"#graph"</span> <span class="token punctuation">)</span> <span class="token punctuation">;</span> <span class="token keyword">var</span> myChart <span class="token operator">=</span> <span class="token keyword">new</span> <span class="token class-name">Chart</span> <span class="token punctuation">(</span> pie <span class="token punctuation">,</span> <span class="token punctuation">{</span> type <span class="token operator">:</span> <span class="token string">'pie'</span> <span class="token punctuation">,</span> data <span class="token operator">:</span> <span class="token punctuation">{</span> labels <span class="token operator">:</span> labels <span class="token punctuation">,</span> datasets <span class="token operator">:</span> <span class="token punctuation">[</span> <span class="token punctuation">{</span> data <span class="token operator">:</span> result <span class="token punctuation">,</span> borderColor <span class="token operator">:</span> <span class="token punctuation">[</span> <span class="token string">"rgba(217, 83, 79,1)"</span> <span class="token punctuation">,</span> <span class="token string">"rgba(240, 173, 78, 1)"</span> <span class="token punctuation">,</span> <span class="token string">"rgba(92, 184, 92, 1)"</span> <span class="token punctuation">]</span> <span class="token punctuation">,</span> backgroundColor <span class="token operator">:</span> <span class="token punctuation">[</span> <span class="token string">"rgba(217, 83, 79,0.2)"</span> <span class="token punctuation">,</span> <span class="token string">"rgba(240, 173, 78, 0.2)"</span> <span class="token punctuation">,</span> <span class="token string">"rgba(92, 184, 92, 0.2)"</span> <span class="token punctuation">]</span> <span class="token punctuation">,</span> <span class="token punctuation">}</span> <span class="token punctuation">]</span> <span class="token punctuation">}</span> <span class="token punctuation">,</span> options <span class="token operator">:</span> <span class="token punctuation">{</span> title <span class="token operator">:</span> <span class="token punctuation">{</span> display <span class="token operator">:</span> <span class="token boolean">true</span> <span class="token punctuation">,</span> text <span class="token operator">:</span> <span class="token string">"Chuyên ngành"</span> <span class="token punctuation">}</span> <span class="token punctuation">}</span> <span class="token punctuation">}</span> <span class="token punctuation">)</span> <span class="token punctuation">;</span> <span class="token punctuation">}</span> <span class="token punctuation">)</span> <span class="token punctuation">;</span> <span class="token punctuation">}</span> </span></span> <span class="token tag"><span class="token tag"><span class="token punctuation"></</span> script</span> <span class="token punctuation">></span></span> <span class="token tag"><span class="token tag"><span class="token punctuation"></</span> body</span> <span class="token punctuation">></span></span> <span class="token tag"><span class="token tag"><span class="token punctuation"></</span> html</span> <span class="token punctuation">></span></span> |
In it we use the post function on the previously processed data.php file to get the data returned as JSON. After receiving the returned data, it will be assigned to each label and data for each label.
Once the data has been assigned, we can proceed with custom colors for the chart by setting bordercolor and backgroundcolor as you like.
$("#graph"); Is the ID of the card where you want to display your chart.
After completing the steps above, you have to create a Chart with the type of chart you want. Chart.js supports many types of charts such as:
- line
- bar
- radar
- …
Or you can draw a bar chart as follows
1 2 3 4 5 6 7 8 9 10 11 12 13 14 15 16 17 18 19 20 21 22 23 24 25 26 27 28 29 30 31 32 33 34 35 36 37 38 39 40 41 42 43 44 45 46 47 48 49 50 51 52 53 54 55 56 57 58 59 60 61 62 63 64 65 66 67 68 69 70 71 72 73 74 75 76 77 78 79 80 81 82 83 84 | <span class="token operator"><</span> <span class="token operator">!</span> <span class="token constant">DOCTYPE</span> html <span class="token operator">></span> <span class="token operator"><</span> html <span class="token operator">></span> <span class="token operator"><</span> head <span class="token operator">></span> <span class="token operator"><</span> title <span class="token operator">></span> <span class="token constant">T</span> ạo biểu đồ sử dụng <span class="token constant">PHP</span> và Chart <span class="token punctuation">.</span> js <span class="token operator"><</span> <span class="token operator">/</span> title <span class="token operator">></span> <span class="token operator"><</span> style type <span class="token operator">=</span> <span class="token double-quoted-string string">"text/css"</span> <span class="token operator">></span> <span class="token constant">BODY</span> <span class="token punctuation">{</span> width <span class="token punctuation">:</span> <span class="token number">550</span> <span class="token constant">PX</span> <span class="token punctuation">;</span> <span class="token punctuation">}</span> <span class="token shell-comment comment">#chart-container {</span> width <span class="token punctuation">:</span> <span class="token number">100</span> <span class="token operator">%</span> <span class="token punctuation">;</span> height <span class="token punctuation">:</span> auto <span class="token punctuation">;</span> <span class="token punctuation">}</span> <span class="token operator"><</span> <span class="token operator">/</span> style <span class="token operator">></span> <span class="token operator"><</span> script type <span class="token operator">=</span> <span class="token double-quoted-string string">"text/javascript"</span> src <span class="token operator">=</span> <span class="token double-quoted-string string">"js/jquery.min.js"</span> <span class="token operator">></span> <span class="token operator"><</span> <span class="token operator">/</span> script <span class="token operator">></span> <span class="token operator"><</span> script type <span class="token operator">=</span> <span class="token double-quoted-string string">"text/javascript"</span> src <span class="token operator">=</span> <span class="token double-quoted-string string">"js/Chart.min.js"</span> <span class="token operator">></span> <span class="token operator"><</span> <span class="token operator">/</span> script <span class="token operator">></span> <span class="token operator"><</span> <span class="token operator">/</span> head <span class="token operator">></span> <span class="token operator"><</span> body <span class="token operator">></span> <span class="token operator"><</span> div id <span class="token operator">=</span> <span class="token double-quoted-string string">"chart-container"</span> <span class="token operator">></span> <span class="token operator"><</span> canvas id <span class="token operator">=</span> <span class="token double-quoted-string string">"graph"</span> <span class="token operator">></span> <span class="token operator"><</span> <span class="token operator">/</span> canvas <span class="token operator">></span> <span class="token operator"><</span> <span class="token operator">/</span> div <span class="token operator">></span> <span class="token operator"><</span> script <span class="token operator">></span> $ <span class="token punctuation">(</span> document <span class="token punctuation">)</span> <span class="token punctuation">.</span> <span class="token function">ready</span> <span class="token punctuation">(</span> <span class="token keyword">function</span> <span class="token punctuation">(</span> <span class="token punctuation">)</span> <span class="token punctuation">{</span> <span class="token function">showGraph</span> <span class="token punctuation">(</span> <span class="token punctuation">)</span> <span class="token punctuation">;</span> <span class="token punctuation">}</span> <span class="token punctuation">)</span> <span class="token punctuation">;</span> <span class="token keyword">function</span> <span class="token function">showGraph</span> <span class="token punctuation">(</span> <span class="token punctuation">)</span> <span class="token punctuation">{</span> $ <span class="token punctuation">.</span> <span class="token function">post</span> <span class="token punctuation">(</span> <span class="token double-quoted-string string">"data.php"</span> <span class="token punctuation">,</span> <span class="token keyword">function</span> <span class="token punctuation">(</span> data <span class="token punctuation">)</span> <span class="token punctuation">{</span> console <span class="token punctuation">.</span> <span class="token function">log</span> <span class="token punctuation">(</span> data <span class="token punctuation">)</span> <span class="token punctuation">;</span> <span class="token keyword">var</span> formStatusVar <span class="token operator">=</span> <span class="token punctuation">[</span> <span class="token punctuation">]</span> <span class="token punctuation">;</span> <span class="token keyword">var</span> total <span class="token operator">=</span> <span class="token punctuation">[</span> <span class="token punctuation">]</span> <span class="token punctuation">;</span> <span class="token keyword">for</span> <span class="token punctuation">(</span> <span class="token keyword">var</span> i in data <span class="token punctuation">)</span> <span class="token punctuation">{</span> formStatusVar <span class="token punctuation">.</span> <span class="token function">push</span> <span class="token punctuation">(</span> data <span class="token punctuation">[</span> i <span class="token punctuation">]</span> <span class="token punctuation">.</span> status <span class="token punctuation">)</span> <span class="token punctuation">;</span> total <span class="token punctuation">.</span> <span class="token function">push</span> <span class="token punctuation">(</span> data <span class="token punctuation">[</span> i <span class="token punctuation">]</span> <span class="token punctuation">.</span> size_status <span class="token punctuation">)</span> <span class="token punctuation">;</span> <span class="token punctuation">}</span> <span class="token keyword">var</span> options <span class="token operator">=</span> <span class="token punctuation">{</span> legend <span class="token punctuation">:</span> <span class="token punctuation">{</span> display <span class="token punctuation">:</span> <span class="token boolean constant">false</span> <span class="token punctuation">}</span> <span class="token punctuation">,</span> scales <span class="token punctuation">:</span> <span class="token punctuation">{</span> xAxes <span class="token punctuation">:</span> <span class="token punctuation">[</span> <span class="token punctuation">{</span> display <span class="token punctuation">:</span> <span class="token boolean constant">true</span> <span class="token punctuation">}</span> <span class="token punctuation">]</span> <span class="token punctuation">,</span> yAxes <span class="token punctuation">:</span> <span class="token punctuation">[</span> <span class="token punctuation">{</span> ticks <span class="token punctuation">:</span> <span class="token punctuation">{</span> beginAtZero <span class="token punctuation">:</span> <span class="token boolean constant">true</span> <span class="token punctuation">}</span> <span class="token punctuation">}</span> <span class="token punctuation">]</span> <span class="token punctuation">}</span> <span class="token punctuation">}</span> <span class="token punctuation">;</span> <span class="token keyword">var</span> myChart <span class="token operator">=</span> <span class="token punctuation">{</span> labels <span class="token punctuation">:</span> formStatusVar <span class="token punctuation">,</span> datasets <span class="token punctuation">:</span> <span class="token punctuation">[</span> <span class="token punctuation">{</span> label <span class="token punctuation">:</span> <span class="token single-quoted-string string">'Tổng số'</span> <span class="token punctuation">,</span> backgroundColor <span class="token punctuation">:</span> <span class="token single-quoted-string string">'#17cbd1'</span> <span class="token punctuation">,</span> borderColor <span class="token punctuation">:</span> <span class="token single-quoted-string string">'#46d5f1'</span> <span class="token punctuation">,</span> hoverBackgroundColor <span class="token punctuation">:</span> <span class="token single-quoted-string string">'#0ec2b6'</span> <span class="token punctuation">,</span> hoverBorderColor <span class="token punctuation">:</span> <span class="token single-quoted-string string">'#42f5ef'</span> <span class="token punctuation">,</span> data <span class="token punctuation">:</span> total <span class="token punctuation">}</span> <span class="token punctuation">]</span> <span class="token punctuation">}</span> <span class="token punctuation">;</span> <span class="token keyword">var</span> bar <span class="token operator">=</span> $ <span class="token punctuation">(</span> <span class="token double-quoted-string string">"#graph"</span> <span class="token punctuation">)</span> <span class="token punctuation">;</span> <span class="token keyword">var</span> barGraph <span class="token operator">=</span> <span class="token keyword">new</span> <span class="token class-name">Chart</span> <span class="token punctuation">(</span> bar <span class="token punctuation">,</span> <span class="token punctuation">{</span> type <span class="token punctuation">:</span> <span class="token single-quoted-string string">'bar'</span> <span class="token punctuation">,</span> data <span class="token punctuation">:</span> myChart <span class="token punctuation">,</span> options <span class="token punctuation">:</span> options <span class="token punctuation">}</span> <span class="token punctuation">)</span> <span class="token punctuation">;</span> <span class="token punctuation">}</span> <span class="token punctuation">)</span> <span class="token punctuation">;</span> <span class="token punctuation">}</span> <span class="token operator"><</span> <span class="token operator">/</span> script <span class="token operator">></span> <span class="token operator"><</span> <span class="token operator">/</span> body <span class="token operator">></span> <span class="token operator"><</span> <span class="token operator">/</span> html <span class="token operator">></span> |
Conclude
The article above is a simple example of ChartJS hope it will help you in the first step of understanding the chart on the website.
To learn more, you can refer to Chart.js or some other documents to customize the chart for more beautiful.