In the field of science computing, it can be said that Julia is one of the most used languages today. It is a free and open source programming language that can give high performance and even compete with the most popular programming languages like Python and R in the field of data science. Often used in data science problems, it is obvious to say that Julia herself and its libraries can be used to easily solve the problem of this field, one of them. is to visualize data into graphs, … so that users can easily extract knowledge from data instead of just working with soulless numbers. This article introduces Julia as well as using some of Julia’s libraries to create graphs from existing data.
What is Julia
Julia is a free and open source programming language widely used in scientific computing. It features optional typing, multi-orchestration, and good performance, achieved using the type reference feature and Just-In-Time (JIT) compilation, implemented with LLVM. It is also a diverse model, combining features of imperative, functional and object-oriented programming languages. Julia provides ease and expressiveness for advanced numeric computation, like languages like R, MATLAB, and Python, but also supports general programming.
Although a number of other languages were available earlier, most notably Python is also commonly used to process and extract data with a clean syntax that is easy to read as well as easy to learn and use. However, the language is an interpreted language and therefore is often assessed as poor performance. The use of libraries with computational functions written in C (Numpy, …) partly solves the above mentioned, however, Python’s parallel computing or concurrency computing mechanisms are quite limited. are important features in the future when the amount of data to process becomes more and more.
For the above reason, in 2012, the Julia language was introduced and it is expected that there will be the same advantages as above that can significantly improve performance. And indeed, Julia uses JIT (Just In Time) compilation mechanism built on LLVM platform, Julia code will be translated directly into machine code, so the processing speed can be compared with C or C ++. In addition, it also supports parallel computing or concurrency computing mechanisms as well as provides libraries like Matlab to be able to support the necessary processing operations such as vector or matrix computation. .
Install and use Julia
Setting
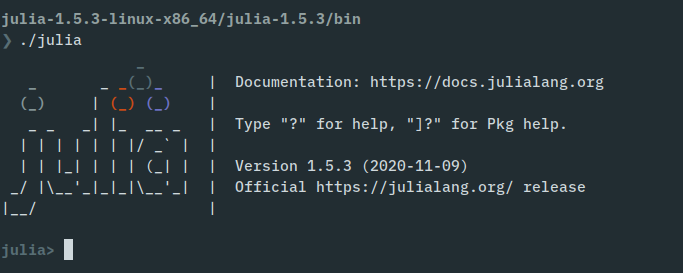
To be able to use it, we go to https://julialang.org/downloads/ then select the section corresponding to your operating system and click download to download an archive. Julia does not require any additional components to be able to run (at least true on linux and the rest of the operating systems I have not tried: v). Once unzipped, you can use Julia by executing the file named julia in the bin directory.
Alternatively, you can install Julia in other ways such as installing from chocolatey on Windows using the command choco install julia --confirm or sudo apt install julia if you are using Debian / Ubuntu. For more details please visit https://julialang.org/downloads/platform/
Use
If you’ve ever used Python, you will get to know Julia without much effort. Open a terminal and type julia , and Julia will execute each line of code every time you press Enter.
Julia files usually have .jl extension and can be executed by typing julia ten_cua_file.jl . The package implementation in Julia works a little differently from the other package managers. Julia performs package installation when a piece of Julia code is run (calling the function to perform the installation) instead of needing us to install it first.
Data visualization using Julia’s library
Besides some charting packages like Plots.jl , Julia has a few other packages like PlotlyJS . Julia’s PlotlyJS package not only quickly creates visual charts, but also provides interoperability with countless different chart types for each specific purpose.
To be able to use it, use the following command to let Julia automatically download the Plotly package
1 2 3 | using Pkg Pkg.add("PlotlyJS") |
Next is the configuration to use Ploty using the following code:
1 2 | using PlotlyJS |
Starting with a basic line chart, PlotlyJS can easily be drawn using plot() function plot()
1 2 3 4 5 6 7 8 9 10 11 | using PlotlyJS, DataFrames, CSV, Dates function linescatter() trace1 = scatter(;x=1:4, y=[10, 15, 13, 17], mode="markers") trace2 = scatter(;x=2:5, y=[16, 5, 11, 9], mode="lines") trace3 = scatter(;x=1:4, y=[12, 9, 15, 12], mode="lines+markers") plot([trace1, trace2, trace3]) savefig("img2") end linescatter() |
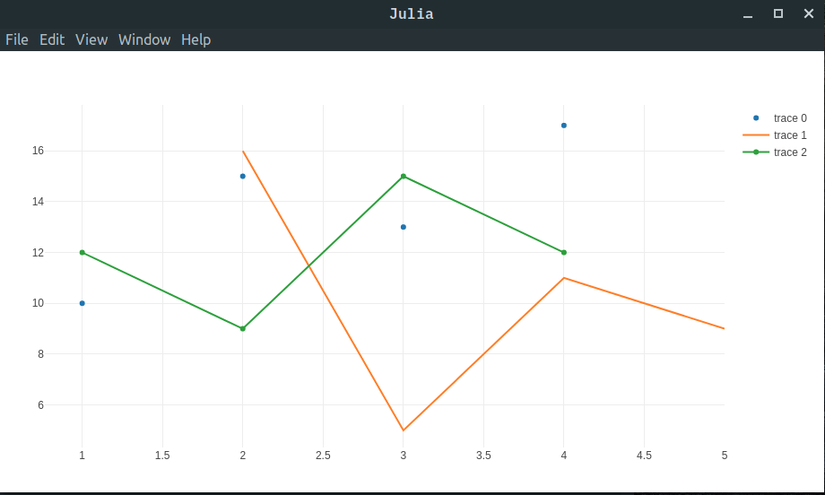
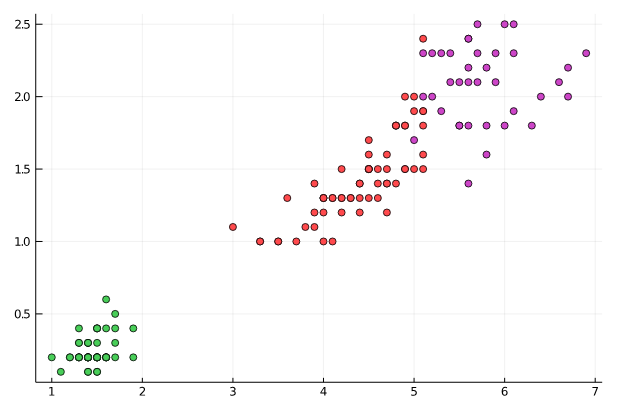
Then we can interact, zoom in as well as move and capture the chart in png format. Not only that, we can quickly cluster data with Clustering.jl . The following example shows how easy and explicit it is to be done.
1 2 3 4 5 6 7 8 9 10 11 12 13 14 15 16 17 18 19 20 21 22 23 24 | Using Pkg Pkg.add("Clustering") Pkg.add("Plots") using RDatasets, Clustering, Plots X = rand(5, 1000) R = kmeans(X, 20; maxiter=200, display=:iter) @assert nclusters(R) == 20 a = assignments(R) c = counts(R) M = R.centers iris = dataset("datasets", "iris") features = collect(Matrix(iris[:, 1:4])') result = kmeans(features, 3) # scatter(iris.PetalLength, iris.PetalWidth, marker_z=result.assignments, color=:lightrainbow, legend=false) |
Then the result will be as follows:
summary
This article introduces Julia as well as using some of Julia’s libraries to create graphs from available data. Through the first part, we can also see that Julia is very easy to learn and use. Anyone who is familiar with Python and Matlab can quickly get acquainted and use it. Besides, Julia also has many useful libraries like Clustering.jl and mentioned above PlotlyJS.jl . This article has ended, thank you for taking the time to read.