Have you ever asked yourself the question: When users are experiencing, communicating with the application they feel lag when using an application? The answer is not always clear, but most of the time it has to do with heavy CPU tasks, and there are also cases where these types of performance problems are related to memory. Of course, you can print logs to help you troubleshoot, but you need to be quite familiar with the codebase to place logs where appropriate.
If you want to explore another option that doesn’t rely solely on logs, then use Android Profiler , introduced in Android Studio 3.0. Developers can use this tool to monitor CPU usage and memory usage, block response networks and even monitor power consumption. Based on the data provided by Android Profiler, we can gain a better understanding of how our applications use CPU and other memory resources. These are the last points that can lead us to the root cause of the problem. In this article, we will discuss methods to solve performance issues systematically using Android Profiler.
1. Memory Problems
Let’s review Android memory management so we can understand why inappropriate memory usage can contribute to performance issues. An Android application, like any other software application, runs in a memory-limited environment, in which the Android OS assigns a limited but very flexible (flexible) memory heap to each application. is launched. Throughout the life of an application, the Android OS allocates memory to the application to store instructions and program data. The amount of required memory varies in different application use cases. For example, an application needs more memory to display full-screen bitmaps than full-screen text.
When a memory is no longer needed, the Android OS automatically recovers this memory resource so that it can be reused to serve new memory allocation requests. This process is often called Garbage Collection .
Garbage Collection usually does not affect the performance of the application, because the application downtime caused by a Garbage Collection process is negligible. However, if too many Garbage Collection events occur in a short period of time, users will begin to experience a slow user experience in the application.
2. Memory Profiling with Android Profiler
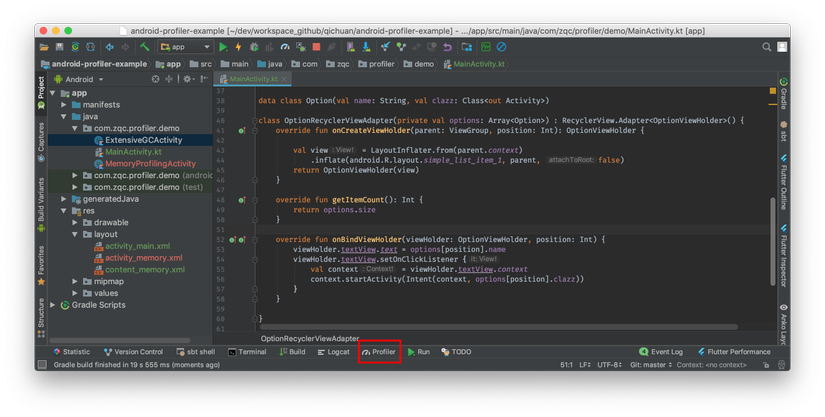
The prerequisites for Android Profiler are a version of Android Studio 3.0 or higher and a connected test device (physical device) or emulator (virtual machine) is running at least Android SDK Level 26. Please click Click the Profiler tab in the bottom panel to launch Android Profiler.
Run your application in debug mode and you will see Android Profiler displaying real-time metrics for CPU, Memory, Network and Energy.
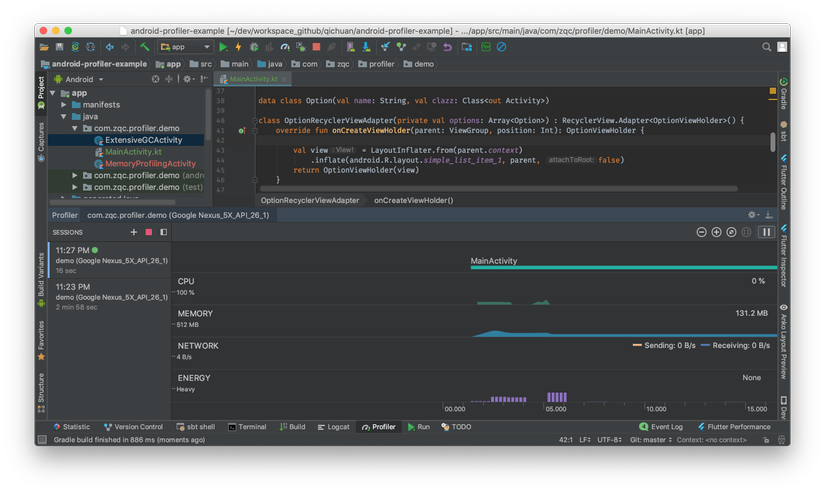
Clicking on the Memory section to see details of memory usage data, Android Profiler provides a visual overview of memory usage over time.
 Android Profiler memory profiling
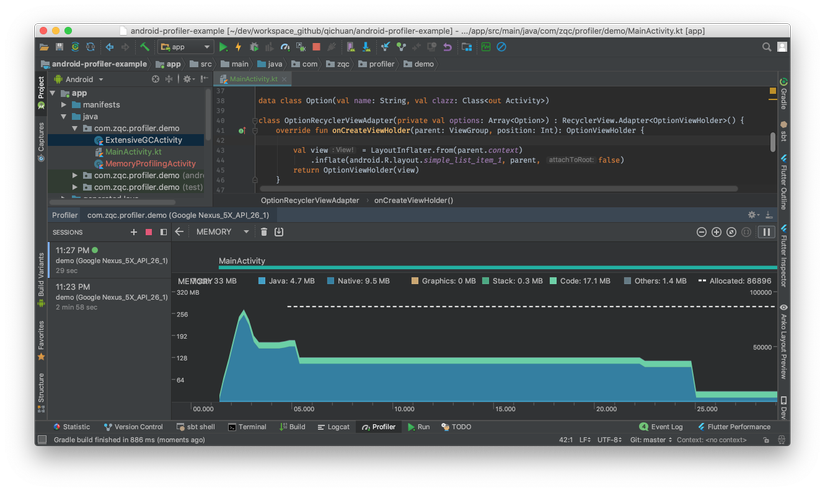
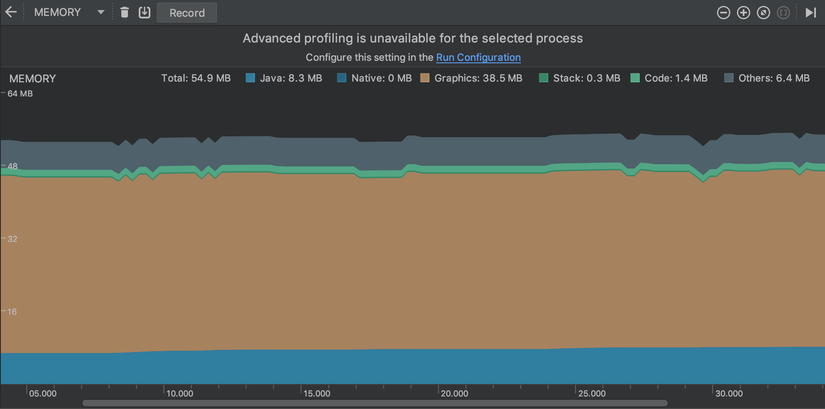
As you can see in the diagram above, there is a spike at first when the application is launched for the first time, followed by a drop drop and finally a flat line. This is typical behavior of a simple hello world application, because there’s so much going on here. A flat memory chart (falt) means stable memory usage and it is the ideal memory situation that we want to achieve.
3. Android Profiler in Action
Let’s look at a few sample diagrams to signal memory problems. You can use the source code from this GitHub repo to reproduce the problem.
3.1. A growing graph (A growing graph)
If you observe a trend line that only goes up and rarely goes down, it’s probably due to a memory leak, which means that some part of the memory cannot be freed. Or simply not enough memory to deal with the application. When the application has reached the memory limit and the Android operating system cannot allocate additional memory to the application, OutOfMemoryError will occur.
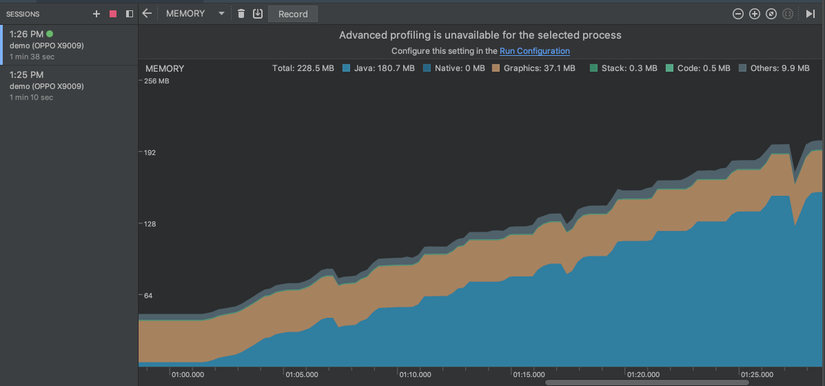 A growing memory usage graph
This problem can be reproduced in the High Memory Usage example from the demo application. This example basically creates a large number of rows (100k) and adds these rows to linearLayout. (Of course in practice, this is not a common thing in Android, but I just want to show an extreme case when creating multiple views can cause memory problems, as shown in source code below.)
1 2 3 4 5 6 7 8 9 10 11 12 13 14 15 16 17 18 19 20 21 22 23 24 25 26 27 28 29 30 31 32 33 34 35 36 37 38 39 40 41 42 43 44 45 46 47 48 49 50 51 52 53 54 55 56 57 58 59 60 | <span class="token comment">/*** * In order to stress the memory usage, * this activity creates 100000 rows of TextView when user clicks on the start button */</span> <span class="token keyword">class</span> <span class="token class-name">HighMemoryUsageActivity</span> <span class="token operator">:</span> <span class="token function">AppCompatActivity</span> <span class="token punctuation">(</span> <span class="token punctuation">)</span> <span class="token punctuation">{</span> val NO_OF_TEXTVIEWS_ADDED <span class="token operator">=</span> <span class="token number">100000</span> override fun <span class="token function">onCreate</span> <span class="token punctuation">(</span> savedInstanceState <span class="token operator">:</span> Bundle <span class="token operator">?</span> <span class="token punctuation">)</span> <span class="token punctuation">{</span> <span class="token keyword">super</span> <span class="token punctuation">.</span> <span class="token function">onCreate</span> <span class="token punctuation">(</span> savedInstanceState <span class="token punctuation">)</span> <span class="token function">setContentView</span> <span class="token punctuation">(</span> R <span class="token punctuation">.</span> layout <span class="token punctuation">.</span> activity_high_memory_usage <span class="token punctuation">)</span> supportActionBar <span class="token operator">?</span> <span class="token punctuation">.</span> <span class="token function">setDisplayHomeAsUpEnabled</span> <span class="token punctuation">(</span> <span class="token boolean">true</span> <span class="token punctuation">)</span> supportActionBar <span class="token operator">?</span> <span class="token punctuation">.</span> <span class="token function">setTitle</span> <span class="token punctuation">(</span> R <span class="token punctuation">.</span> string <span class="token punctuation">.</span> activity_name_high_memory_usage <span class="token punctuation">)</span> btn_start <span class="token punctuation">.</span> setOnClickListener <span class="token punctuation">{</span> <span class="token function">addRowsOfTextView</span> <span class="token punctuation">(</span> <span class="token punctuation">)</span> <span class="token punctuation">}</span> <span class="token punctuation">}</span> override fun <span class="token function">onSupportNavigateUp</span> <span class="token punctuation">(</span> <span class="token punctuation">)</span> <span class="token operator">:</span> Boolean <span class="token punctuation">{</span> <span class="token function">onBackPressed</span> <span class="token punctuation">(</span> <span class="token punctuation">)</span> <span class="token keyword">return</span> <span class="token boolean">true</span> <span class="token punctuation">}</span> <span class="token comment">/** * Add rows of text views to the root LinearLayout */</span> <span class="token keyword">private</span> fun <span class="token function">addRowsOfTextView</span> <span class="token punctuation">(</span> <span class="token punctuation">)</span> <span class="token punctuation">{</span> val linearLayout <span class="token operator">=</span> findViewById <span class="token generics function"><span class="token punctuation"><</span> LinearLayout <span class="token punctuation">></span></span> <span class="token punctuation">(</span> R <span class="token punctuation">.</span> id <span class="token punctuation">.</span> linear_layout <span class="token punctuation">)</span> val textViewParams <span class="token operator">=</span> LinearLayout <span class="token punctuation">.</span> <span class="token function">LayoutParams</span> <span class="token punctuation">(</span> LinearLayout <span class="token punctuation">.</span> LayoutParams <span class="token punctuation">.</span> MATCH_PARENT <span class="token punctuation">,</span> LinearLayout <span class="token punctuation">.</span> LayoutParams <span class="token punctuation">.</span> WRAP_CONTENT <span class="token punctuation">)</span> val textViews <span class="token operator">=</span> arrayOfNulls <span class="token generics function"><span class="token punctuation"><</span> TextView <span class="token punctuation">></span></span> <span class="token punctuation">(</span> NO_OF_TEXTVIEWS_ADDED <span class="token punctuation">)</span> <span class="token keyword">for</span> <span class="token punctuation">(</span> i in <span class="token number">0</span> until NO_OF_TEXTVIEWS_ADDED <span class="token punctuation">)</span> <span class="token punctuation">{</span> textViews <span class="token punctuation">[</span> i <span class="token punctuation">]</span> <span class="token operator">=</span> <span class="token function">TextView</span> <span class="token punctuation">(</span> <span class="token keyword">this</span> <span class="token punctuation">)</span> textViews <span class="token punctuation">[</span> i <span class="token punctuation">]</span> <span class="token operator">?</span> <span class="token punctuation">.</span> layoutParams <span class="token operator">=</span> textViewParams textViews <span class="token punctuation">[</span> i <span class="token punctuation">]</span> <span class="token operator">?</span> <span class="token punctuation">.</span> text <span class="token operator">=</span> i <span class="token punctuation">.</span> <span class="token function">toString</span> <span class="token punctuation">(</span> <span class="token punctuation">)</span> textViews <span class="token punctuation">[</span> i <span class="token punctuation">]</span> <span class="token operator">?</span> <span class="token punctuation">.</span> <span class="token function">setBackgroundColor</span> <span class="token punctuation">(</span> <span class="token function">getRandomColor</span> <span class="token punctuation">(</span> <span class="token punctuation">)</span> <span class="token punctuation">)</span> linearLayout <span class="token punctuation">.</span> <span class="token function">addView</span> <span class="token punctuation">(</span> textViews <span class="token punctuation">[</span> i <span class="token punctuation">]</span> <span class="token punctuation">)</span> linearLayout <span class="token punctuation">.</span> <span class="token function">invalidate</span> <span class="token punctuation">(</span> <span class="token punctuation">)</span> <span class="token punctuation">}</span> <span class="token punctuation">}</span> <span class="token comment">/** * Creates a random color for background color of the text view. */</span> <span class="token keyword">private</span> fun <span class="token function">getRandomColor</span> <span class="token punctuation">(</span> <span class="token punctuation">)</span> <span class="token operator">:</span> Int <span class="token punctuation">{</span> val r <span class="token operator">=</span> <span class="token function">Random</span> <span class="token punctuation">(</span> <span class="token punctuation">)</span> val red <span class="token operator">=</span> r <span class="token punctuation">.</span> <span class="token function">nextInt</span> <span class="token punctuation">(</span> <span class="token number">255</span> <span class="token punctuation">)</span> val green <span class="token operator">=</span> r <span class="token punctuation">.</span> <span class="token function">nextInt</span> <span class="token punctuation">(</span> <span class="token number">255</span> <span class="token punctuation">)</span> val blue <span class="token operator">=</span> r <span class="token punctuation">.</span> <span class="token function">nextInt</span> <span class="token punctuation">(</span> <span class="token number">255</span> <span class="token punctuation">)</span> <span class="token keyword">return</span> Color <span class="token punctuation">.</span> <span class="token function">rgb</span> <span class="token punctuation">(</span> red <span class="token punctuation">,</span> green <span class="token punctuation">,</span> blue <span class="token punctuation">)</span> <span class="token punctuation">}</span> <span class="token punctuation">}</span> |
This activity does not use any Adapter or RecyclerView to recycle item views. Therefore, it takes 100 thousand views to complete the implementation of addRowsOfTextView ().
Now, click the Start button and monitor memory usage in Android Studio. The memory usage continues to increase and eventually the application crashes. This is the behavior we would expect it to happen.
The solution to this problem is very simple. By simply applying RecyclerView to reuse item views, it can greatly reduce the number of create views. The diagram below is the memory usage for displaying 100,000 item views and you can see an improvement in the Low Memory Usage example with RecyclerView.
Memory optimization by using RecyclerView
3.2. Turbulence in a short period of time (Turbulence)
Turbulence is an indicator of instability and this also applies to Android memory usage. When we look at this model, there are often a lot of expensive objects created and thrown in their short lifespan. The CPU is wasting a lot of performance performing garbage collection, but not doing actual work for the application. Users may experience sluggish user interfaces and we should definitely optimize memory usage in this case.
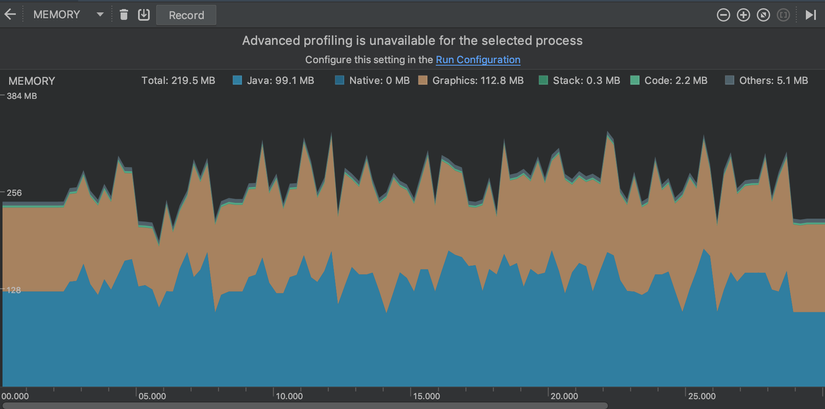 A memory usage turbulence
To reproduce this problem, run the GC Number example from the demo application. This example uses RecyclerView to display two alternate bitmaps: one large bitmap image with 1000 x 1000 resolution and one smaller than 256 x 256. Move RecyclerView and you will see obvious disturbances in the Program. Memory creation and sluggish user experience in mobile apps.
Laggy RecyclerView
1 2 3 4 5 6 7 8 9 10 11 12 13 14 15 16 17 18 19 20 21 22 23 24 25 26 27 28 29 30 31 32 33 34 35 36 37 38 39 40 41 42 43 44 45 46 47 48 | <span class="token keyword">class</span> <span class="token class-name">NumerousGCActivity</span> <span class="token operator">:</span> <span class="token function">AppCompatActivity</span> <span class="token punctuation">(</span> <span class="token punctuation">)</span> <span class="token punctuation">{</span> val NO_OF_VIEWS <span class="token operator">=</span> <span class="token number">100000</span> override fun <span class="token function">onCreate</span> <span class="token punctuation">(</span> savedInstanceState <span class="token operator">:</span> Bundle <span class="token operator">?</span> <span class="token punctuation">)</span> <span class="token punctuation">{</span> <span class="token keyword">super</span> <span class="token punctuation">.</span> <span class="token function">onCreate</span> <span class="token punctuation">(</span> savedInstanceState <span class="token punctuation">)</span> <span class="token function">setContentView</span> <span class="token punctuation">(</span> R <span class="token punctuation">.</span> layout <span class="token punctuation">.</span> activity_numerous_gc <span class="token punctuation">)</span> btn_start <span class="token punctuation">.</span> setOnClickListener <span class="token punctuation">{</span> <span class="token function">setupRecyclerView</span> <span class="token punctuation">(</span> <span class="token punctuation">)</span> <span class="token punctuation">}</span> <span class="token punctuation">}</span> <span class="token keyword">private</span> fun <span class="token function">setupRecyclerView</span> <span class="token punctuation">(</span> <span class="token punctuation">)</span> <span class="token punctuation">{</span> val numbers <span class="token operator">=</span> arrayOfNulls <span class="token generics function"><span class="token punctuation"><</span> Int <span class="token punctuation">></span></span> <span class="token punctuation">(</span> NO_OF_VIEWS <span class="token punctuation">)</span> <span class="token punctuation">.</span> mapIndexed <span class="token punctuation">{</span> index <span class="token punctuation">,</span> _ <span class="token operator">-</span> <span class="token operator">></span> index <span class="token punctuation">}</span> recyclerView <span class="token punctuation">.</span> layoutManager <span class="token operator">=</span> <span class="token function">LinearLayoutManager</span> <span class="token punctuation">(</span> <span class="token keyword">this</span> <span class="token punctuation">)</span> recyclerView <span class="token punctuation">.</span> adapter <span class="token operator">=</span> <span class="token function">NumerousGCRecyclerViewAdapter</span> <span class="token punctuation">(</span> numbers <span class="token punctuation">)</span> <span class="token punctuation">}</span> <span class="token punctuation">}</span> <span class="token keyword">class</span> <span class="token class-name">NumerousGCRecyclerViewAdapter</span> <span class="token punctuation">(</span> <span class="token keyword">private</span> val numbers <span class="token operator">:</span> List <span class="token generics function"><span class="token punctuation"><</span> Int <span class="token punctuation">></span></span> <span class="token punctuation">)</span> <span class="token operator">:</span> RecyclerView <span class="token punctuation">.</span> Adapter <span class="token generics function"><span class="token punctuation"><</span> NumerousGCViewHolder <span class="token punctuation">></span></span> <span class="token punctuation">(</span> <span class="token punctuation">)</span> <span class="token punctuation">{</span> override fun <span class="token function">onCreateViewHolder</span> <span class="token punctuation">(</span> parent <span class="token operator">:</span> ViewGroup <span class="token punctuation">,</span> viewType <span class="token operator">:</span> Int <span class="token punctuation">)</span> <span class="token operator">:</span> NumerousGCViewHolder <span class="token punctuation">{</span> val view <span class="token operator">=</span> LayoutInflater <span class="token punctuation">.</span> <span class="token function">from</span> <span class="token punctuation">(</span> parent <span class="token punctuation">.</span> context <span class="token punctuation">)</span> <span class="token punctuation">.</span> <span class="token function">inflate</span> <span class="token punctuation">(</span> R <span class="token punctuation">.</span> layout <span class="token punctuation">.</span> item_numerous_gc <span class="token punctuation">,</span> parent <span class="token punctuation">,</span> <span class="token boolean">false</span> <span class="token punctuation">)</span> <span class="token keyword">return</span> <span class="token function">NumerousGCViewHolder</span> <span class="token punctuation">(</span> view <span class="token punctuation">)</span> <span class="token punctuation">}</span> override fun <span class="token function">getItemCount</span> <span class="token punctuation">(</span> <span class="token punctuation">)</span> <span class="token operator">:</span> Int <span class="token punctuation">{</span> <span class="token keyword">return</span> numbers <span class="token punctuation">.</span> size <span class="token punctuation">}</span> override fun <span class="token function">onBindViewHolder</span> <span class="token punctuation">(</span> vh <span class="token operator">:</span> NumerousGCViewHolder <span class="token punctuation">,</span> position <span class="token operator">:</span> Int <span class="token punctuation">)</span> <span class="token punctuation">{</span> vh <span class="token punctuation">.</span> textView <span class="token punctuation">.</span> text <span class="token operator">=</span> position <span class="token punctuation">.</span> <span class="token function">toString</span> <span class="token punctuation">(</span> <span class="token punctuation">)</span> <span class="token comment">//Create bitmap from resource</span> val bitmap <span class="token operator">=</span> <span class="token keyword">if</span> <span class="token punctuation">(</span> position <span class="token operator">%</span> <span class="token number">2</span> <span class="token operator">==</span> <span class="token number">0</span> <span class="token punctuation">)</span> BitmapFactory <span class="token punctuation">.</span> <span class="token function">decodeResource</span> <span class="token punctuation">(</span> vh <span class="token punctuation">.</span> imageView <span class="token punctuation">.</span> context <span class="token punctuation">.</span> resources <span class="token punctuation">,</span> R <span class="token punctuation">.</span> drawable <span class="token punctuation">.</span> big_bitmap <span class="token punctuation">)</span> <span class="token keyword">else</span> BitmapFactory <span class="token punctuation">.</span> <span class="token function">decodeResource</span> <span class="token punctuation">(</span> vh <span class="token punctuation">.</span> imageView <span class="token punctuation">.</span> context <span class="token punctuation">.</span> resources <span class="token punctuation">,</span> R <span class="token punctuation">.</span> drawable <span class="token punctuation">.</span> small_bitmap <span class="token punctuation">)</span> vh <span class="token punctuation">.</span> imageView <span class="token punctuation">.</span> <span class="token function">setImageBitmap</span> <span class="token punctuation">(</span> bitmap <span class="token punctuation">)</span> <span class="token punctuation">}</span> <span class="token punctuation">}</span> <span class="token keyword">class</span> <span class="token class-name">NumerousGCViewHolder</span> <span class="token punctuation">(</span> itemView <span class="token operator">:</span> View <span class="token punctuation">)</span> <span class="token operator">:</span> RecyclerView <span class="token punctuation">.</span> <span class="token function">ViewHolder</span> <span class="token punctuation">(</span> itemView <span class="token punctuation">)</span> <span class="token punctuation">{</span> var textView <span class="token operator">:</span> TextView <span class="token operator">=</span> itemView <span class="token punctuation">.</span> <span class="token function">findViewById</span> <span class="token punctuation">(</span> R <span class="token punctuation">.</span> id <span class="token punctuation">.</span> text_view <span class="token punctuation">)</span> var imageView <span class="token operator">:</span> ImageView <span class="token operator">=</span> itemView <span class="token punctuation">.</span> <span class="token function">findViewById</span> <span class="token punctuation">(</span> R <span class="token punctuation">.</span> id <span class="token punctuation">.</span> image_view <span class="token punctuation">)</span> <span class="token punctuation">}</span> |
In this case, the sample code is implementing RecyclerView but we still have memory issues. Although RecyclerView is the solution to previous memory problems, it is not a bullet that solves all memory problems. To find the root cause, we need more information to analyze.
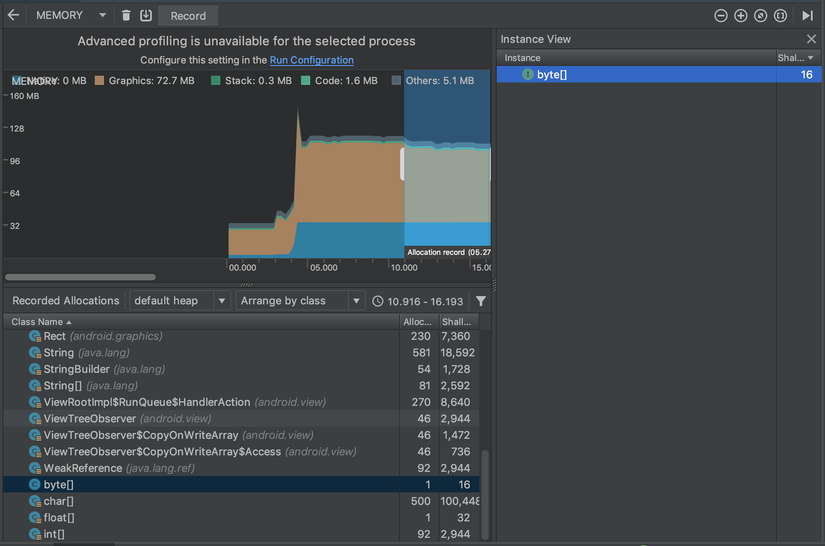
Click the Record button in the Memory Profiler, scroll RecyclerView for a while and click the stop button. Profiler will show you a detailed memory usage list sorted by object type.
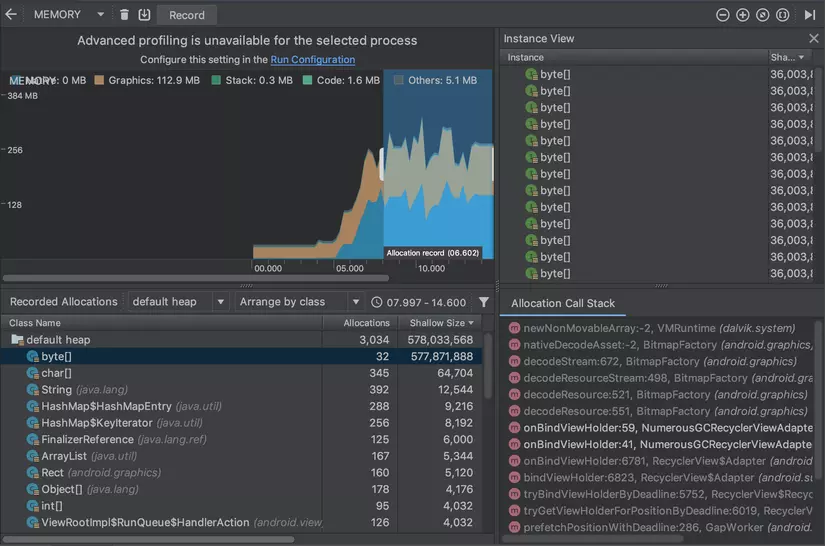
The detailed memory usage
Sorting the list by Shallow size and the top item is the same byte array, so we know that most memory allocations are attributed to the byte array creation actions. There are only 32 allocations for the byte array and its total size is 577,871,888 bits, which is 72.23 MB. To find out more, click one of the instances in the instance view and view allocation call stack. The highlighted method is the NumerousGCRecyclerViewAdapter’s onBindViewHolder (), but we haven’t created any byte arrays explicitly with this method.
Take a closer look at the onBindViewHolder () method in the stack. Method calls go from decodeResource () -> decodeResourceStream () -> decodeStream () -> nativeDecodeAsset () and finally to newNonMovableArray (). The documentation for this method says:
Returns an array allocated in an area of the Java heap where it will never be moved. This is used to implement native allocations on the Java heap, such as DirectByteBuffers and Bitmaps.
Means: Returns an allocated array in an area of the Java heap where it will never be moved. This is used to make native allocations on the Java heap, such as DirectByteBuffers and Bitmap.
Therefore, we can conclude that a lot of byte arrays are created right here using the nativeDecodeAsset () method. Each time we call BitmapFactory.decodeResource (), a new version of the bitmap object is created and therefore the byte array data is beneath it. If we can reduce the frequency of the BitmapFactory.decodeResource () requests, we can avoid the need to allocate additional memory and thus reduce the appearance of the Garbage Collection.
1 2 3 4 5 6 7 8 9 10 11 12 13 14 15 16 17 18 19 20 21 22 23 24 25 | <span class="token keyword">class</span> <span class="token class-name">LessNumerousGCRecyclerViewAdapter</span> <span class="token punctuation">(</span> <span class="token keyword">private</span> val context <span class="token operator">:</span> Context <span class="token punctuation">,</span> <span class="token keyword">private</span> val numbers <span class="token operator">:</span> List <span class="token generics function"><span class="token punctuation"><</span> Int <span class="token punctuation">></span></span> <span class="token punctuation">)</span> <span class="token operator">:</span> RecyclerView <span class="token punctuation">.</span> Adapter <span class="token generics function"><span class="token punctuation"><</span> NumerousGCViewHolder <span class="token punctuation">></span></span> <span class="token punctuation">(</span> <span class="token punctuation">)</span> <span class="token punctuation">{</span> val bitBitmap <span class="token operator">=</span> BitmapFactory <span class="token punctuation">.</span> <span class="token function">decodeResource</span> <span class="token punctuation">(</span> context <span class="token punctuation">.</span> resources <span class="token punctuation">,</span> R <span class="token punctuation">.</span> drawable <span class="token punctuation">.</span> big_bitmap <span class="token punctuation">)</span> val smallBitmap <span class="token operator">=</span> BitmapFactory <span class="token punctuation">.</span> <span class="token function">decodeResource</span> <span class="token punctuation">(</span> context <span class="token punctuation">.</span> resources <span class="token punctuation">,</span> R <span class="token punctuation">.</span> drawable <span class="token punctuation">.</span> small_bitmap <span class="token punctuation">)</span> override fun <span class="token function">onCreateViewHolder</span> <span class="token punctuation">(</span> parent <span class="token operator">:</span> ViewGroup <span class="token punctuation">,</span> viewType <span class="token operator">:</span> Int <span class="token punctuation">)</span> <span class="token operator">:</span> NumerousGCViewHolder <span class="token punctuation">{</span> val view <span class="token operator">=</span> LayoutInflater <span class="token punctuation">.</span> <span class="token function">from</span> <span class="token punctuation">(</span> parent <span class="token punctuation">.</span> context <span class="token punctuation">)</span> <span class="token punctuation">.</span> <span class="token function">inflate</span> <span class="token punctuation">(</span> R <span class="token punctuation">.</span> layout <span class="token punctuation">.</span> item_numerous_gc <span class="token punctuation">,</span> parent <span class="token punctuation">,</span> <span class="token boolean">false</span> <span class="token punctuation">)</span> <span class="token keyword">return</span> <span class="token function">NumerousGCViewHolder</span> <span class="token punctuation">(</span> view <span class="token punctuation">)</span> <span class="token punctuation">}</span> override fun <span class="token function">getItemCount</span> <span class="token punctuation">(</span> <span class="token punctuation">)</span> <span class="token operator">:</span> Int <span class="token punctuation">{</span> <span class="token keyword">return</span> numbers <span class="token punctuation">.</span> size <span class="token punctuation">}</span> override fun <span class="token function">onBindViewHolder</span> <span class="token punctuation">(</span> vh <span class="token operator">:</span> NumerousGCViewHolder <span class="token punctuation">,</span> position <span class="token operator">:</span> Int <span class="token punctuation">)</span> <span class="token punctuation">{</span> vh <span class="token punctuation">.</span> textView <span class="token punctuation">.</span> text <span class="token operator">=</span> position <span class="token punctuation">.</span> <span class="token function">toString</span> <span class="token punctuation">(</span> <span class="token punctuation">)</span> <span class="token comment">//Reuse bitmap</span> val bitmap <span class="token operator">=</span> <span class="token keyword">if</span> <span class="token punctuation">(</span> position <span class="token operator">%</span> <span class="token number">2</span> <span class="token operator">==</span> <span class="token number">0</span> <span class="token punctuation">)</span> bitBitmap <span class="token keyword">else</span> smallBitmap vh <span class="token punctuation">.</span> imageView <span class="token punctuation">.</span> <span class="token function">setImageBitmap</span> <span class="token punctuation">(</span> bitmap <span class="token punctuation">)</span> <span class="token punctuation">}</span> <span class="token punctuation">}</span> |
This is an improved version of the RecyclerViewAdapter, only creating bitmap instances once, storing them and reusing these bitmaps for imageView in the onBindViewHolder () method. Any other unnecessary memory allocation is avoided. Please review at the memory chart after improvement.
We see a flat memory usage graph and there is only one allocation for a byte array and its size is insignificant. In addition, the application can now scroll smoothly without any slowness.  Smooth RecyclerView
Summary
Through this article, I hope it gives you an idea of how to use profiling tools to analyze performance issues. And always pay attention to the use of memory in the application and avoid unnecessary memory resource allocation.
Thanks for reading!
References: