Use goaccess to visualize access log nginx / apache
In case you need to analyze access log to search for information such as statistic status code server returns, geographic origin statistics of users, statistics which top dynamic files are most requested, top static file statistics Which requests are most … Those query results will give you the basis to make the necessary adjustments such as caching multiple files requested, creating cache servers in geographical areas with multiple requests, determining server status via status codes. If there are too many 5xx or 4xx responses, there should be a problem.
If before, you would have to combine different query commands to extract information from the log access file. Usually, this command is quite complicated, and sometimes I don't even know if it is correct ? Goaccess will solve this problem for you.
Installing goaccess is very simple:
I get the access log template in document logstash:
https://download.elastic.co/demos/logstash/gettingstarted/logstash-tutorial.log.gz
Try a sample request:
1 | 83.149.9.216 - - [04 Jan / 2015: 05: 13: 42 +0000] "GET /presentations/logstash-monitorama-2013/images/kibana-search.png HTTP / 1.1" 200 203023 "http: // semicomplete .com / presentations / logstash-monitorama-2013 / "" Mozilla / 5.0 (Macintosh; Intel Mac OS X 10_9_1) AppleWebKit / 537.36 (KHTML, like Gecko) Chrome / 32.0.1700.77 Safari / 537.36 " |
Based on goaccess's man page:
https://goaccess.io/man#custom-log
I will configure log-format to match the request form.
Configure /usr/local/etc/goaccess.conf
1 2 3 | time-format% H:% M:% S date-format% d /% b /% Y log-format% h% ^ [% d:% t% ^] "% r"% s% b "% R" "% u" |
Then run:
1 | goaccess -f logstash-tutorial.log -a |
Result:
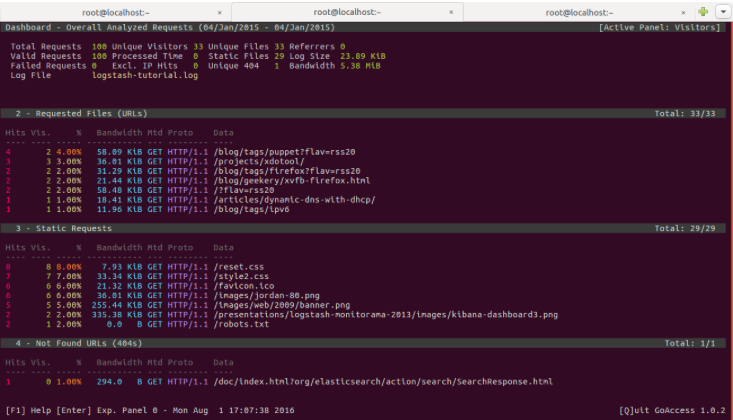
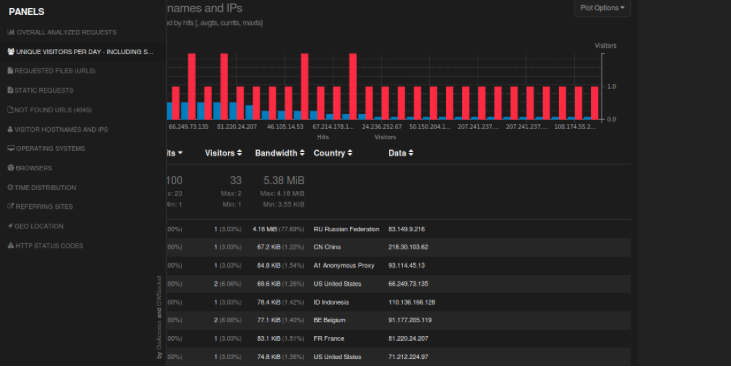
Or can be viewed in dashboard form:
1 | goaccess -f logstash-tutorial.log -a -o report.html |
Some minor tricks in using goaccess can be found at the end of this article: