Continuous Integration (CI – Continuous Integration) is the method that Agile teams use to ensure that the code of the whole project is always built, always running correctly by automatically conducting a retrieval test to detect the fastest error. may. Integrating CI into their projects is the choice of most software development teams as almost all developers find that this approach helps to reduce integration problems and allows development of the parts. Soft mounts faster. This article introduces Lighthouse CI – a set of tools used in running performance analysis on the development process for a web application and how to integrate it with CircleCI.
What is Lighthouse CI
Lighthouse CI is a suite of tools that make continuously running, saving, retrieving, and asserting against Lighthouse results as easy as possible.
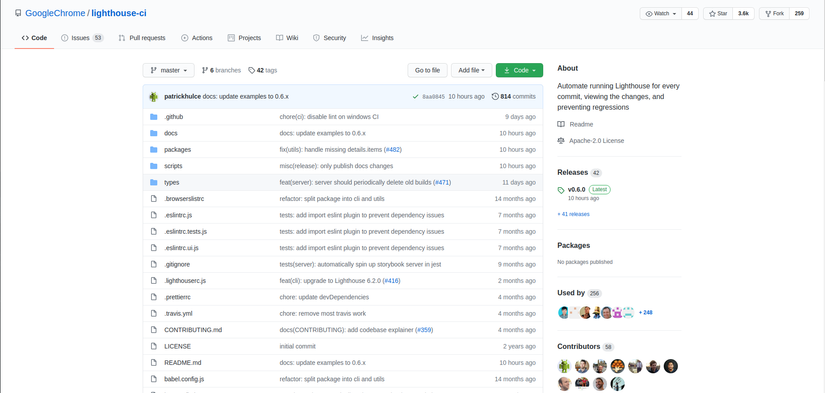
From the introduction in the Overview, we can understand that Lighthouse CI is a set of tools that make it as easy to run, save, retrieve and validate Lighthouse results as possible. This is an open source project developed by a team from Google that has been released in 42 versions (current version is 0.6.0).
Speaking of Lighthouse , this is an automatic open source Google tool used to analyze, measure and improve website quality. Lighthouse will help you comprehensively check the criteria needed for the web to function properly, including: performance, accessibility, progressive web app, SEO capabilities, … and many more. It can be said that Lighthouse is the most comprehensive tool of Google today to help users evaluate the website accurately. In addition to its extensive analytical capabilities, this tool also offers useful tips for you to improve the quality of your website.
To be able to visualize the return results of Lighthouse CI we can observe the results when using Lighthouse in Chrome DevTools first. The Chrome DevTools Audits panel is currently granted the right to apply Google Lighthouse to the website. To create a report, we need to perform the following steps on Google Chrome browser.
- Access the website you want to check using the Google Chrome browser.
- Press F12 or press Ctrl – Shift – I to open Developer Tools. Then select the
Lighthousetab. - Tick the items you want to analyze in Categories (should select all items to be reported completely) as well as select Device type.
- Click the Generate report button. After a short time,
Lighthousewill automatically display the analytics results of the page.
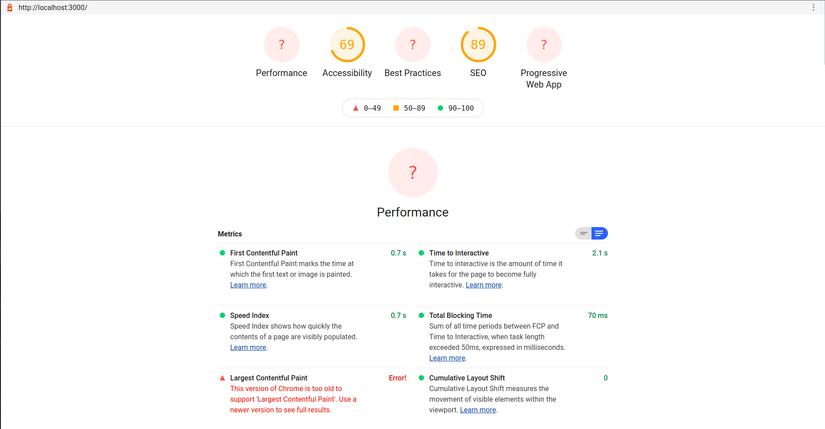
Assuming that for a page with Viblo’s Followings page, after running, Lighthouse returns us the following result:
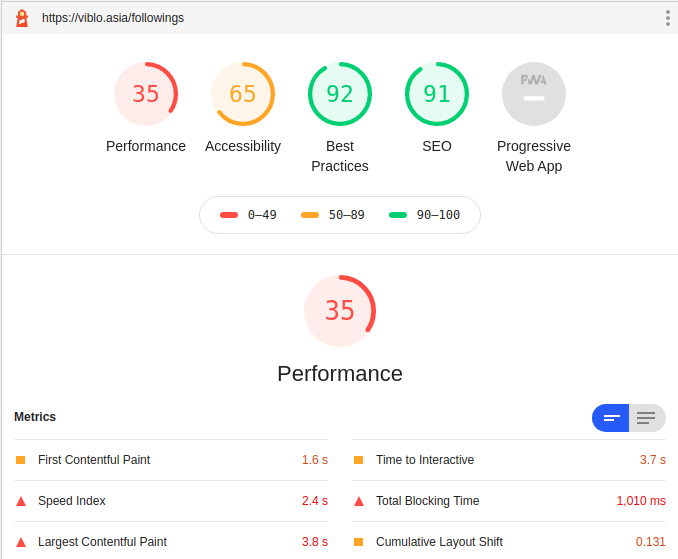
It can be seen that the results returned by Lighthouse include both scores and details, so it can be said that this result is quite complete and intuitive. Items that Lighthouse inspects include the following:
Performance: The performance score is the weighted average of the scores. Naturally, higher weight metrics have a greater impact on your overall Performance score. Metric scores are not shown in the report, but are calculated in detail. The metrics that measure along with its weight are:- First Contentful Paint – 15%: measures how long a browser takes to render the first portion of the DOM content after a user has navigated to your page.
- Speed Index – 15%: measure how quickly content is visually displayed during page loading. First, Lighthouse shoots a video of the page load in the browser and calculates the progress of images between frames. Lighthouse then uses the Speedline Node.js module to generate a Speed Index score.
- Largest Contentful Paint – 25%: reports the render time of the largest image or block of text visible in the viewport.
- Time to Interactive – 15%: measure how long a page becomes fully interactive.
- Total Blocking Time – 25%: measures the total time that a blocked page responds to user input, such as a click, a tap on the screen or a keyboard press
- Cumulative Layout Shift – 5%: measure the sum of all individual layout change points for any unwanted layout changes that occur over the lifetime of the page.
Accessibility: calculates the weighted average score of all accessibility tests according to the criteria listed at https://web.dev/accessibility-scoring/Best Practices: calculating based on the available criteria that ‘Lighthouse’ recommends to use to improve the overall code status of the web application https://web.dev/lighthouse-best-practices/SEO: ability-based score calculation ensures that your page is optimized for search engine result ranking. Criteria for this section are listed at https://web.dev/lighthouse-seo/Progressive Web App: Calculate score by validating aspects of Progressive Web App. Similar to the above sections, the criteria are fully provided at https://web.dev/lighthouse-pwa/
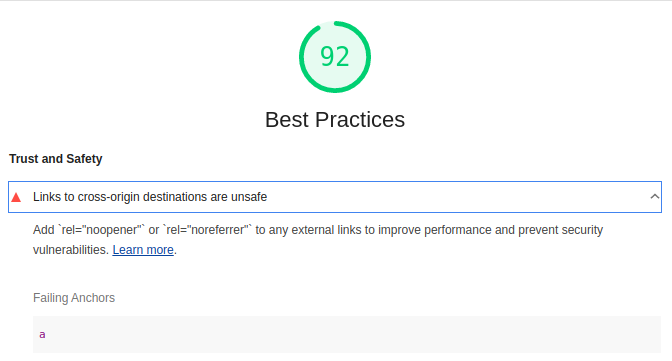
Throughout the report, Lighthouse not only raises the problem of the website, but also provides some suggestions for how we can improve the quality of the website such as:
Integrate Lighthouse CI with CircleCi
Although being provided with a full report on your website, but having to do it manually on each page takes a lot of time and effort and it is difficult to combine with the CI system that the project uses. To solve that problem Lighthouse CI can be used to automatically inspect and generate reports. The following section will guide the integration of Lighthouse CI with CircleCi.
Project preparation
To save time we will use an existing project to integrate Lighthouse CI with Github Action. Go to this fork repository https://github.com/nuxt-company/demo-blog-nuxt-content and clone to install the dependencies with yarn and test with yarn dev we can see the results by visiting http: // localhost: 3000 /

Setup with CircleCI
First, in the root directory of the project we run the following command to add Lighthouse cli
1 2 | <span class="token function">yarn</span> <span class="token function">add</span> -D @lhci/cli |
Then add the script to package.json
1 2 3 4 5 6 7 8 | <span class="token punctuation">{</span> <span class="token string">"scripts"</span> <span class="token operator">:</span> <span class="token punctuation">{</span> <span class="token operator">...</span> <span class="token string">"lhci"</span> <span class="token operator">:</span> <span class="token string">"lhci autorun"</span> <span class="token punctuation">,</span> <span class="token operator">...</span> <span class="token punctuation">}</span> <span class="token punctuation">}</span> |
Next, create a configuration file for Lighthouse CI . Create a file called .lighthouserc.json just below the root of the project and write the following.
1 2 3 4 5 6 7 8 9 10 11 12 13 14 15 16 17 18 19 20 21 22 23 24 25 | module <span class="token punctuation">.</span> exports <span class="token operator">=</span> <span class="token punctuation">{</span> ci <span class="token operator">:</span> <span class="token punctuation">{</span> collect <span class="token operator">:</span> <span class="token punctuation">{</span> numberOfRuns <span class="token operator">:</span> <span class="token number">1</span> <span class="token punctuation">,</span> startServerCommand <span class="token operator">:</span> <span class="token string">'yarn start'</span> <span class="token punctuation">,</span> url <span class="token operator">:</span> <span class="token punctuation">[</span> <span class="token string">'http://localhost:3000/'</span> <span class="token punctuation">,</span> <span class="token string">'http://localhost:3000/blog/my-third-blog-post'</span> <span class="token punctuation">,</span> <span class="token string">'http://localhost:3000/blog/tag/web_development'</span> <span class="token punctuation">]</span> <span class="token punctuation">}</span> <span class="token punctuation">,</span> assert <span class="token operator">:</span> <span class="token punctuation">{</span> preset <span class="token operator">:</span> <span class="token string">'lighthouse:no-pwa'</span> <span class="token punctuation">,</span> assertions <span class="token operator">:</span> <span class="token punctuation">{</span> <span class="token string">'offscreen-images'</span> <span class="token operator">:</span> <span class="token string">'off'</span> <span class="token punctuation">,</span> <span class="token string">'uses-webp-images'</span> <span class="token operator">:</span> <span class="token string">'off'</span> <span class="token punctuation">,</span> <span class="token string">'uses-http2'</span> <span class="token operator">:</span> <span class="token string">'off'</span> <span class="token punctuation">}</span> <span class="token punctuation">}</span> <span class="token punctuation">,</span> upload <span class="token operator">:</span> <span class="token punctuation">{</span> target <span class="token operator">:</span> <span class="token string">'temporary-public-storage'</span> <span class="token punctuation">}</span> <span class="token punctuation">}</span> <span class="token punctuation">}</span> |
The url field is where we tell Lighthouse CI to check which pages to check.
Next is to install the Lighthouse CI App at https://github.com/apps/lighthouse-ci for your project on Github. Once installed, you will get a LHCI_GITHUB_APP_TOKEN . This token will be used to add the Environment Variables CircleCI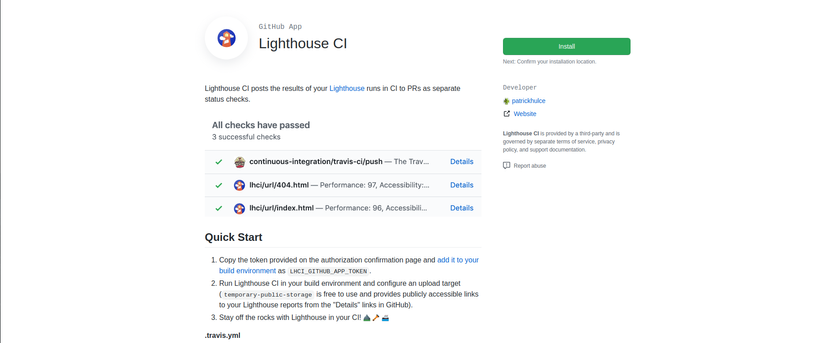
The next step is to connect your project to CircleCI. CircleCI requires config to be able to perform CI process, so we create a config.yml file with the following content to usej:
1 2 3 4 5 6 7 8 9 10 11 12 13 14 15 16 17 18 19 20 21 22 23 24 25 26 27 28 29 30 31 32 33 34 35 36 37 38 39 | <span class="token key atrule">version</span> <span class="token punctuation">:</span> <span class="token number">2.1</span> <span class="token key atrule">commands</span> <span class="token punctuation">:</span> <span class="token key atrule">restore_npm_cache</span> <span class="token punctuation">:</span> <span class="token key atrule">description</span> <span class="token punctuation">:</span> <span class="token string">"Restore npm cache"</span> <span class="token key atrule">steps</span> <span class="token punctuation">:</span> <span class="token punctuation">-</span> <span class="token key atrule">restore_cache</span> <span class="token punctuation">:</span> <span class="token key atrule">keys</span> <span class="token punctuation">:</span> <span class="token punctuation">-</span> v1 <span class="token punctuation">-</span> dependencies <span class="token punctuation">-</span> <span class="token punctuation">{</span> <span class="token punctuation">{</span> checksum "package.json" <span class="token punctuation">}</span> <span class="token punctuation">}</span> <span class="token punctuation">-</span> v1 <span class="token punctuation">-</span> dependencies <span class="token punctuation">-</span> <span class="token key atrule">save_npm_cache</span> <span class="token punctuation">:</span> <span class="token key atrule">description</span> <span class="token punctuation">:</span> <span class="token string">"Save npm cache"</span> <span class="token key atrule">steps</span> <span class="token punctuation">:</span> <span class="token punctuation">-</span> <span class="token key atrule">save_cache</span> <span class="token punctuation">:</span> <span class="token key atrule">paths</span> <span class="token punctuation">:</span> <span class="token punctuation">-</span> node_modules <span class="token key atrule">key</span> <span class="token punctuation">:</span> v1 <span class="token punctuation">-</span> dependencies <span class="token punctuation">-</span> <span class="token punctuation">{</span> <span class="token punctuation">{</span> checksum "package.json" <span class="token punctuation">}</span> <span class="token punctuation">}</span> <span class="token key atrule">jobs</span> <span class="token punctuation">:</span> <span class="token key atrule">lighthouse</span> <span class="token punctuation">:</span> <span class="token key atrule">docker</span> <span class="token punctuation">:</span> <span class="token punctuation">-</span> <span class="token key atrule">image</span> <span class="token punctuation">:</span> circleci/node <span class="token punctuation">:</span> 12.3 <span class="token punctuation">-</span> browsers <span class="token key atrule">working_directory</span> <span class="token punctuation">:</span> ~/repo <span class="token key atrule">steps</span> <span class="token punctuation">:</span> <span class="token punctuation">-</span> checkout <span class="token punctuation">-</span> restore_npm_cache <span class="token punctuation">-</span> <span class="token key atrule">run</span> <span class="token punctuation">:</span> yarn install <span class="token punctuation">-</span> save_npm_cache <span class="token punctuation">-</span> <span class="token key atrule">run</span> <span class="token punctuation">:</span> yarn build <span class="token punctuation">-</span> <span class="token key atrule">run</span> <span class="token punctuation">:</span> <span class="token key atrule">name</span> <span class="token punctuation">:</span> lhci autorun <span class="token key atrule">command</span> <span class="token punctuation">:</span> yarn lhci <span class="token punctuation">|</span> <span class="token punctuation">|</span> echo "LHCI failed <span class="token tag">!</span> " <span class="token key atrule">workflows</span> <span class="token punctuation">:</span> <span class="token key atrule">version</span> <span class="token punctuation">:</span> <span class="token number">2</span> <span class="token key atrule">build</span> <span class="token punctuation">:</span> <span class="token key atrule">jobs</span> <span class="token punctuation">:</span> <span class="token punctuation">-</span> lighthouse |
The last step is to enter LHCI_GITHUB_APP_TOKEN into Environment Variables for your project in CircleCI by selecting Projects Setting > Environment Variables
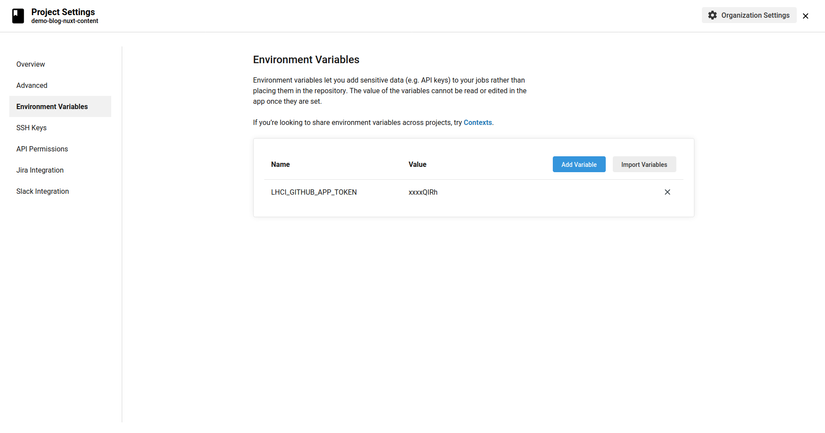
Voilà. At this point, we have integrated Lighthouse CI completely into CircleCi. Creates any push-up commit. Then the Lighthouse CI will run and we will get the following results:
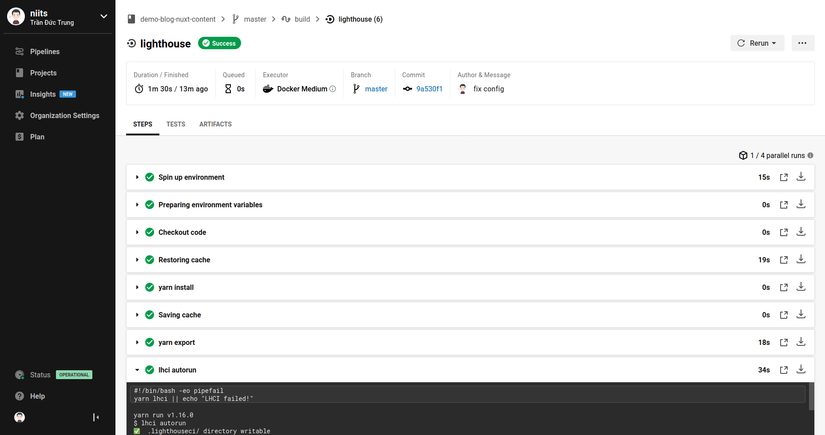
After running, Lighthouse CI sends reports on Github Action and displays a list in each commit.
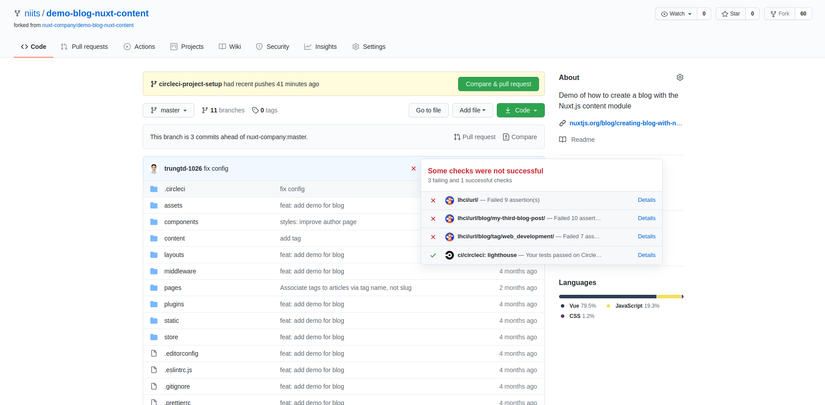
We can see the details of each report by clicking on Detail It can be seen that the generated report has the same parts as when we did it on Google DevTools.
summary
Can find that Lighthouse CI is a useful tool as it allows you to automatically check performance as well as some other criteria before merging to find any code that may affect the quality of your website. your. Lighthouse CI is also available in other CIs, so it can be used in Travis CI and GitHub Actions. This article introduces Lighthouse CI – a set of tools used in running performance analysis on the development process for a web application and how to integrate it with CircleCi. This article is over, thank you everyone for taking the time to read.