Drawing native React graphs is easy to hear. There are many libraries that provide us with available charts, but often we want to create our own charts with specific designs that are suitable for our purposes. The purpose of this article is to do that, I will show you the process of creating a chart for myself.
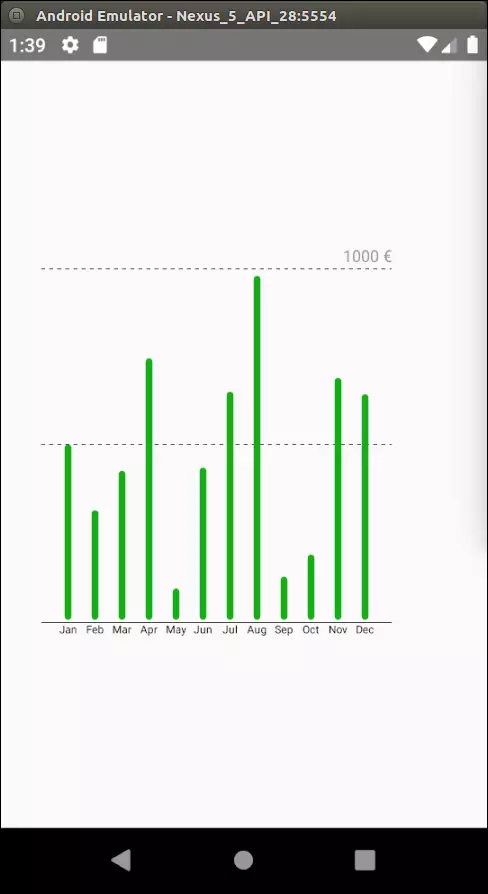
We will build a chart as follows:
Install dependencies
As mentioned in the title: we need two libraries, react-native-svg and d3.js.
1 | npm i --save d3 npm i --save react-native-svg react-native link react-native-svg |
Let’s draw!
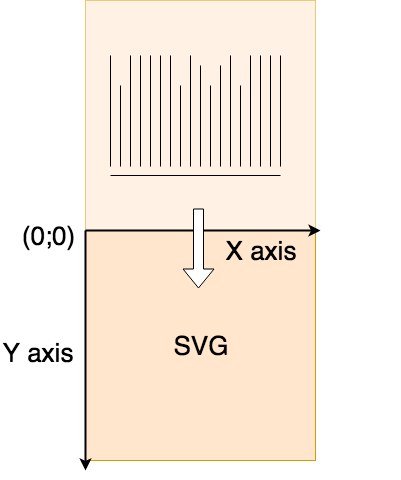
The chart of columns that we draw is displayed from bottom to top. The problem is that the vertical axis (Y axis) of SVG works from top to bottom. We will use a technique to simplify drawing.
We will plot the value of the coordinate Y as a negative value. For example, with a value of 5, we will draw a column from coordinates 0 to -5.
Finally, we need to move the entire chart, because it will now be outside the display frame of SVG.
Now, please work hard to get started.
Let’s add a <Rect> to <SVG> so we can see something on the simulator.
1 | <span class="token keyword">import</span> React <span class="token punctuation">,</span> <span class="token punctuation">{</span> PureComponent <span class="token punctuation">}</span> <span class="token keyword">from</span> <span class="token string">'react'</span> <span class="token keyword">import</span> <span class="token punctuation">{</span> Svg <span class="token punctuation">,</span> <span class="token constant">G</span> <span class="token punctuation">,</span> Rect <span class="token punctuation">}</span> <span class="token keyword">from</span> <span class="token string">'react-native-svg'</span> <span class="token keyword">export</span> <span class="token keyword">default</span> <span class="token keyword">class</span> <span class="token class-name">BarChart</span> <span class="token keyword">extends</span> <span class="token class-name">PureComponent</span> <span class="token punctuation">{</span> <span class="token function">render</span> <span class="token punctuation">(</span> <span class="token punctuation">)</span> <span class="token punctuation">{</span> <span class="token keyword">const</span> SVGHeight <span class="token operator">=</span> <span class="token number">60</span> <span class="token keyword">const</span> SVGWidth <span class="token operator">=</span> <span class="token number">60</span> <span class="token keyword">const</span> graphHeight <span class="token operator">=</span> <span class="token number">50</span> <span class="token keyword">return</span> <span class="token punctuation">(</span> <span class="token operator"><</span> Svg width <span class="token operator">=</span> <span class="token punctuation">{</span> SVGWidth <span class="token punctuation">}</span> height <span class="token operator">=</span> <span class="token punctuation">{</span> SVGHeight <span class="token punctuation">}</span> <span class="token operator">></span> <span class="token punctuation">{</span> <span class="token comment">/* translate for 'graphHeight' on y axis */</span> <span class="token punctuation">}</span> <span class="token operator"><</span> <span class="token constant">G</span> y <span class="token operator">=</span> <span class="token punctuation">{</span> graphHeight <span class="token punctuation">}</span> <span class="token operator">></span> <span class="token operator"><</span> Rect x <span class="token operator">=</span> <span class="token string">"15"</span> y <span class="token operator">=</span> <span class="token string">"-15"</span> width <span class="token operator">=</span> <span class="token string">"20"</span> height <span class="token operator">=</span> <span class="token string">"20"</span> stroke <span class="token operator">=</span> <span class="token string">"red"</span> strokeWidth <span class="token operator">=</span> <span class="token string">"4"</span> fill <span class="token operator">=</span> <span class="token string">"yellow"</span> <span class="token operator">/</span> <span class="token operator">></span> <span class="token operator"><</span> <span class="token operator">/</span> <span class="token constant">G</span> <span class="token operator">></span> <span class="token operator"><</span> <span class="token operator">/</span> Svg <span class="token operator">></span> <span class="token punctuation">)</span> <span class="token punctuation">}</span> <span class="token punctuation">}</span> |
With the above code, we drew a yellow square with a red border and shifted it on the Y axis a distance corresponding to the value of const graphHeight . Notice that the Y coordinates of <Rect> are -5 because we drew it outside the display frame of SVG and moved it inside. Please try checking again to see if your emulator will display in the square.
Create a shaft
We will start with the horizontal axis at the bottom of the chart. The chart we saw earlier was minimal to understand the movement of the chart. Y = 0 is the first coordinate of the columns. We need to determine the margin of the chart where the chart’s parameters will be displayed (For example: Jan, Feb … ).
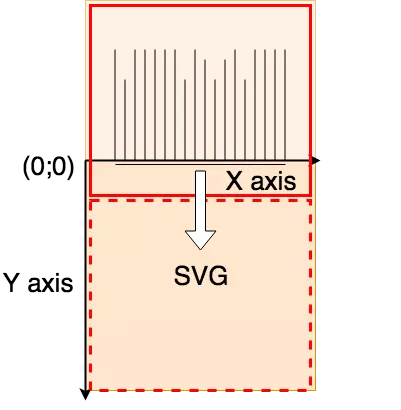
Looking at the above figure, you will see the bottom axis a little bit away from the chart. Because we draw with negative coordinates (starting from zero coordinates) and we want to display the information below the graph, we will assign the bottom axis coordinates Y = 2.
1 | <span class="token keyword">import</span> React <span class="token punctuation">,</span> <span class="token punctuation">{</span> PureComponent <span class="token punctuation">}</span> <span class="token keyword">from</span> <span class="token string">'react'</span> <span class="token punctuation">;</span> <span class="token keyword">import</span> <span class="token punctuation">{</span> Svg <span class="token punctuation">,</span> <span class="token constant">G</span> <span class="token punctuation">,</span> Line <span class="token punctuation">}</span> <span class="token keyword">from</span> <span class="token string">'react-native-svg'</span> <span class="token punctuation">;</span> <span class="token keyword">const</span> <span class="token constant">GRAPH_MARGIN</span> <span class="token operator">=</span> <span class="token number">20</span> <span class="token punctuation">;</span> <span class="token keyword">const</span> colors <span class="token operator">=</span> <span class="token punctuation">{</span> axis <span class="token punctuation">:</span> <span class="token string">'black'</span> <span class="token punctuation">,</span> <span class="token punctuation">}</span> <span class="token punctuation">;</span> <span class="token keyword">export</span> <span class="token keyword">default</span> <span class="token keyword">class</span> <span class="token class-name">BarChart</span> <span class="token keyword">extends</span> <span class="token class-name">PureComponent</span> <span class="token punctuation">{</span> <span class="token function">render</span> <span class="token punctuation">(</span> <span class="token punctuation">)</span> <span class="token punctuation">{</span> <span class="token keyword">const</span> SVGHeight <span class="token operator">=</span> <span class="token number">300</span> <span class="token punctuation">;</span> <span class="token keyword">const</span> SVGWidth <span class="token operator">=</span> <span class="token number">300</span> <span class="token punctuation">;</span> <span class="token keyword">const</span> graphHeight <span class="token operator">=</span> SVGHeight <span class="token operator">-</span> <span class="token number">2</span> <span class="token operator">*</span> <span class="token constant">GRAPH_MARGIN</span> <span class="token punctuation">;</span> <span class="token keyword">const</span> graphWidth <span class="token operator">=</span> SVGWidth <span class="token operator">-</span> <span class="token number">2</span> <span class="token operator">*</span> <span class="token constant">GRAPH_MARGIN</span> <span class="token punctuation">;</span> <span class="token keyword">return</span> <span class="token punctuation">(</span> <span class="token operator"><</span> Svg width <span class="token operator">=</span> <span class="token punctuation">{</span> SVGWidth <span class="token punctuation">}</span> height <span class="token operator">=</span> <span class="token punctuation">{</span> SVGHeight <span class="token punctuation">}</span> <span class="token operator">></span> <span class="token operator"><</span> <span class="token constant">G</span> y <span class="token operator">=</span> <span class="token punctuation">{</span> graphHeight <span class="token punctuation">}</span> <span class="token operator">></span> <span class="token punctuation">{</span> <span class="token comment">/* bottom axis */</span> <span class="token punctuation">}</span> <span class="token operator"><</span> Line x1 <span class="token operator">=</span> <span class="token string">"0"</span> y1 <span class="token operator">=</span> <span class="token string">"2"</span> x2 <span class="token operator">=</span> <span class="token punctuation">{</span> graphWidth <span class="token punctuation">}</span> y2 <span class="token operator">=</span> <span class="token string">"2"</span> stroke <span class="token operator">=</span> <span class="token punctuation">{</span> colors <span class="token punctuation">.</span> axis <span class="token punctuation">}</span> strokeWidth <span class="token operator">=</span> <span class="token string">"0.5"</span> <span class="token operator">/</span> <span class="token operator">></span> <span class="token operator"><</span> <span class="token operator">/</span> <span class="token constant">G</span> <span class="token operator">></span> <span class="token operator"><</span> <span class="token operator">/</span> Svg <span class="token operator">></span> <span class="token punctuation">)</span> <span class="token punctuation">;</span> <span class="token punctuation">}</span> <span class="token punctuation">}</span> |
Create columns
The columns in this chart are simply rectangles with border radius. Now we need some data. Our column-pouring data will be a list of key-value pairs. In javascript we will present this data with an array of objects.
Note: I will remove the validate of the props in this tutorial to focus on charting.
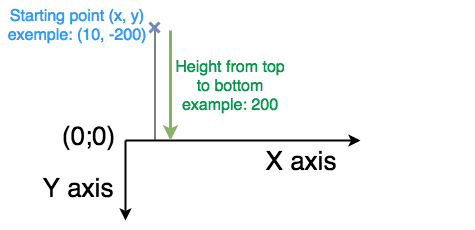
We will decide how the x , y , height and width coordinates for <Rect> ?
We need to remember that the height in SVG will run from top to bottom even if it is drawn with negative coordinates. This means that the starting point (x, y) will be the vertex of the <Rect> and the height represents the distance between the starting and the bottom (Y = 0). The following figure will help you understand this idea:
Now the hard part is finding x and y . What we want to achieve is the highest value that will be the top of the chart, so we will need to divide the scale of the columns according to the highest value.
Please use d3-scale Point scales and d3-scale Linear scales for this. In short, these scaling methods allow us from a value in an internal domain to derive the corresponding value in a range, and we use prices again. value to determine the x and y coordinates. The only interesting thing we need to do after calculating the ratio is to move the column along the X axis by about half the width of the column. Because we use a point scale, we need to move so that the “points” will correspond to the center point of the columns.
Now let’s split the BarChart component into a separate file (create the Components folder and create the BarChart.js file in it). In App.js we will add data to the chart and render the BarChart component.
1 | <span class="token keyword">import</span> React <span class="token keyword">from</span> <span class="token string">'react'</span> <span class="token punctuation">;</span> <span class="token keyword">import</span> <span class="token punctuation">{</span> StyleSheet <span class="token punctuation">,</span> View <span class="token punctuation">}</span> <span class="token keyword">from</span> <span class="token string">'react-native'</span> <span class="token punctuation">;</span> <span class="token keyword">import</span> BarChart <span class="token keyword">from</span> <span class="token string">'./Components/BarChart'</span> <span class="token punctuation">;</span> <span class="token keyword">const</span> <span class="token function-variable function">App</span> <span class="token operator">=</span> <span class="token punctuation">(</span> <span class="token punctuation">)</span> <span class="token operator">=></span> <span class="token punctuation">{</span> <span class="token keyword">const</span> data <span class="token operator">=</span> <span class="token punctuation">[</span> <span class="token punctuation">{</span> label <span class="token punctuation">:</span> <span class="token string">'Jan'</span> <span class="token punctuation">,</span> value <span class="token punctuation">:</span> <span class="token number">500</span> <span class="token punctuation">}</span> <span class="token punctuation">,</span> <span class="token punctuation">{</span> label <span class="token punctuation">:</span> <span class="token string">'Feb'</span> <span class="token punctuation">,</span> value <span class="token punctuation">:</span> <span class="token number">312</span> <span class="token punctuation">}</span> <span class="token punctuation">,</span> <span class="token punctuation">{</span> label <span class="token punctuation">:</span> <span class="token string">'Mar'</span> <span class="token punctuation">,</span> value <span class="token punctuation">:</span> <span class="token number">424</span> <span class="token punctuation">}</span> <span class="token punctuation">,</span> <span class="token punctuation">{</span> label <span class="token punctuation">:</span> <span class="token string">'Apr'</span> <span class="token punctuation">,</span> value <span class="token punctuation">:</span> <span class="token number">745</span> <span class="token punctuation">}</span> <span class="token punctuation">,</span> <span class="token punctuation">{</span> label <span class="token punctuation">:</span> <span class="token string">'May'</span> <span class="token punctuation">,</span> value <span class="token punctuation">:</span> <span class="token number">89</span> <span class="token punctuation">}</span> <span class="token punctuation">,</span> <span class="token punctuation">{</span> label <span class="token punctuation">:</span> <span class="token string">'Jun'</span> <span class="token punctuation">,</span> value <span class="token punctuation">:</span> <span class="token number">434</span> <span class="token punctuation">}</span> <span class="token punctuation">,</span> <span class="token punctuation">{</span> label <span class="token punctuation">:</span> <span class="token string">'Jul'</span> <span class="token punctuation">,</span> value <span class="token punctuation">:</span> <span class="token number">650</span> <span class="token punctuation">}</span> <span class="token punctuation">,</span> <span class="token punctuation">{</span> label <span class="token punctuation">:</span> <span class="token string">'Aug'</span> <span class="token punctuation">,</span> value <span class="token punctuation">:</span> <span class="token number">980</span> <span class="token punctuation">}</span> <span class="token punctuation">,</span> <span class="token punctuation">{</span> label <span class="token punctuation">:</span> <span class="token string">'Sep'</span> <span class="token punctuation">,</span> value <span class="token punctuation">:</span> <span class="token number">123</span> <span class="token punctuation">}</span> <span class="token punctuation">,</span> <span class="token punctuation">{</span> label <span class="token punctuation">:</span> <span class="token string">'Oct'</span> <span class="token punctuation">,</span> value <span class="token punctuation">:</span> <span class="token number">186</span> <span class="token punctuation">}</span> <span class="token punctuation">,</span> <span class="token punctuation">{</span> label <span class="token punctuation">:</span> <span class="token string">'Nov'</span> <span class="token punctuation">,</span> value <span class="token punctuation">:</span> <span class="token number">689</span> <span class="token punctuation">}</span> <span class="token punctuation">,</span> <span class="token punctuation">{</span> label <span class="token punctuation">:</span> <span class="token string">'Dec'</span> <span class="token punctuation">,</span> value <span class="token punctuation">:</span> <span class="token number">643</span> <span class="token punctuation">}</span> <span class="token punctuation">,</span> <span class="token punctuation">]</span> <span class="token punctuation">;</span> <span class="token keyword">return</span> <span class="token punctuation">(</span> <span class="token operator"><</span> View style <span class="token operator">=</span> <span class="token punctuation">{</span> styles <span class="token punctuation">.</span> container <span class="token punctuation">}</span> <span class="token operator">></span> <span class="token operator"><</span> BarChart data <span class="token operator">=</span> <span class="token punctuation">{</span> data <span class="token punctuation">}</span> <span class="token operator">/</span> <span class="token operator">></span> <span class="token operator"><</span> <span class="token operator">/</span> View <span class="token operator">></span> <span class="token punctuation">)</span> <span class="token punctuation">;</span> <span class="token punctuation">}</span> <span class="token punctuation">;</span> <span class="token keyword">const</span> styles <span class="token operator">=</span> StyleSheet <span class="token punctuation">.</span> <span class="token function">create</span> <span class="token punctuation">(</span> <span class="token punctuation">{</span> container <span class="token punctuation">:</span> <span class="token punctuation">{</span> flex <span class="token punctuation">:</span> <span class="token number">1</span> <span class="token punctuation">,</span> justifyContent <span class="token punctuation">:</span> <span class="token string">'center'</span> <span class="token punctuation">,</span> alignItems <span class="token punctuation">:</span> <span class="token string">'center'</span> <span class="token punctuation">,</span> <span class="token punctuation">}</span> <span class="token punctuation">,</span> <span class="token punctuation">}</span> <span class="token punctuation">)</span> <span class="token punctuation">;</span> <span class="token keyword">export</span> <span class="token keyword">default</span> App <span class="token punctuation">;</span> |
1 | <span class="token keyword">import</span> React <span class="token punctuation">,</span> <span class="token punctuation">{</span> PureComponent <span class="token punctuation">}</span> <span class="token keyword">from</span> <span class="token string">'react'</span> <span class="token punctuation">;</span> <span class="token keyword">import</span> <span class="token punctuation">{</span> Svg <span class="token punctuation">,</span> <span class="token constant">G</span> <span class="token punctuation">,</span> Line <span class="token punctuation">,</span> Rect <span class="token punctuation">}</span> <span class="token keyword">from</span> <span class="token string">'react-native-svg'</span> <span class="token punctuation">;</span> <span class="token keyword">import</span> <span class="token operator">*</span> <span class="token keyword">as</span> d3 <span class="token keyword">from</span> <span class="token string">'d3'</span> <span class="token punctuation">;</span> <span class="token keyword">const</span> <span class="token constant">GRAPH_MARGIN</span> <span class="token operator">=</span> <span class="token number">20</span> <span class="token punctuation">;</span> <span class="token keyword">const</span> <span class="token constant">GRAPH_BAR_WIDTH</span> <span class="token operator">=</span> <span class="token number">5</span> <span class="token punctuation">;</span> <span class="token keyword">const</span> colors <span class="token operator">=</span> <span class="token punctuation">{</span> axis <span class="token punctuation">:</span> <span class="token string">'black'</span> <span class="token punctuation">,</span> bars <span class="token punctuation">:</span> <span class="token string">'#15AD13'</span> <span class="token punctuation">,</span> <span class="token punctuation">}</span> <span class="token punctuation">;</span> <span class="token keyword">export</span> <span class="token keyword">default</span> <span class="token keyword">class</span> <span class="token class-name">BarChart</span> <span class="token keyword">extends</span> <span class="token class-name">PureComponent</span> <span class="token punctuation">{</span> <span class="token function">render</span> <span class="token punctuation">(</span> <span class="token punctuation">)</span> <span class="token punctuation">{</span> <span class="token comment">// Dimensions</span> <span class="token keyword">const</span> SVGHeight <span class="token operator">=</span> <span class="token number">300</span> <span class="token punctuation">;</span> <span class="token keyword">const</span> SVGWidth <span class="token operator">=</span> <span class="token number">300</span> <span class="token punctuation">;</span> <span class="token keyword">const</span> graphHeight <span class="token operator">=</span> SVGHeight <span class="token operator">-</span> <span class="token number">2</span> <span class="token operator">*</span> <span class="token constant">GRAPH_MARGIN</span> <span class="token punctuation">;</span> <span class="token keyword">const</span> graphWidth <span class="token operator">=</span> SVGWidth <span class="token operator">-</span> <span class="token number">2</span> <span class="token operator">*</span> <span class="token constant">GRAPH_MARGIN</span> <span class="token punctuation">;</span> <span class="token keyword">const</span> <span class="token punctuation">{</span> data <span class="token punctuation">}</span> <span class="token operator">=</span> <span class="token keyword">this</span> <span class="token punctuation">.</span> props <span class="token punctuation">;</span> <span class="token comment">// X scale point</span> <span class="token keyword">const</span> xDomain <span class="token operator">=</span> data <span class="token punctuation">.</span> <span class="token function">map</span> <span class="token punctuation">(</span> <span class="token punctuation">(</span> item <span class="token punctuation">)</span> <span class="token operator">=></span> item <span class="token punctuation">.</span> label <span class="token punctuation">)</span> <span class="token punctuation">;</span> <span class="token keyword">const</span> xRange <span class="token operator">=</span> <span class="token punctuation">[</span> <span class="token number">0</span> <span class="token punctuation">,</span> graphWidth <span class="token punctuation">]</span> <span class="token punctuation">;</span> <span class="token keyword">const</span> x <span class="token operator">=</span> d3 <span class="token punctuation">.</span> <span class="token function">scalePoint</span> <span class="token punctuation">(</span> <span class="token punctuation">)</span> <span class="token punctuation">.</span> <span class="token function">domain</span> <span class="token punctuation">(</span> xDomain <span class="token punctuation">)</span> <span class="token punctuation">.</span> <span class="token function">range</span> <span class="token punctuation">(</span> xRange <span class="token punctuation">)</span> <span class="token punctuation">.</span> <span class="token function">padding</span> <span class="token punctuation">(</span> <span class="token number">1</span> <span class="token punctuation">)</span> <span class="token punctuation">;</span> <span class="token comment">// Y scale linear</span> <span class="token keyword">const</span> yDomain <span class="token operator">=</span> <span class="token punctuation">[</span> <span class="token number">0</span> <span class="token punctuation">,</span> d3 <span class="token punctuation">.</span> <span class="token function">max</span> <span class="token punctuation">(</span> data <span class="token punctuation">,</span> <span class="token punctuation">(</span> d <span class="token punctuation">)</span> <span class="token operator">=></span> d <span class="token punctuation">.</span> value <span class="token punctuation">)</span> <span class="token punctuation">]</span> <span class="token punctuation">;</span> <span class="token keyword">const</span> yRange <span class="token operator">=</span> <span class="token punctuation">[</span> <span class="token number">0</span> <span class="token punctuation">,</span> graphHeight <span class="token punctuation">]</span> <span class="token punctuation">;</span> <span class="token keyword">const</span> y <span class="token operator">=</span> d3 <span class="token punctuation">.</span> <span class="token function">scaleLinear</span> <span class="token punctuation">(</span> <span class="token punctuation">)</span> <span class="token punctuation">.</span> <span class="token function">domain</span> <span class="token punctuation">(</span> yDomain <span class="token punctuation">)</span> <span class="token punctuation">.</span> <span class="token function">range</span> <span class="token punctuation">(</span> yRange <span class="token punctuation">)</span> <span class="token punctuation">;</span> <span class="token keyword">return</span> <span class="token punctuation">(</span> <span class="token operator"><</span> Svg width <span class="token operator">=</span> <span class="token punctuation">{</span> SVGWidth <span class="token punctuation">}</span> height <span class="token operator">=</span> <span class="token punctuation">{</span> SVGHeight <span class="token punctuation">}</span> <span class="token operator">></span> <span class="token operator"><</span> <span class="token constant">G</span> y <span class="token operator">=</span> <span class="token punctuation">{</span> graphHeight <span class="token punctuation">}</span> <span class="token operator">></span> <span class="token punctuation">{</span> <span class="token comment">/* bars */</span> <span class="token punctuation">}</span> <span class="token punctuation">{</span> data <span class="token punctuation">.</span> <span class="token function">map</span> <span class="token punctuation">(</span> <span class="token punctuation">(</span> item <span class="token punctuation">)</span> <span class="token operator">=></span> <span class="token punctuation">(</span> <span class="token operator"><</span> Rect key <span class="token operator">=</span> <span class="token punctuation">{</span> item <span class="token punctuation">.</span> label <span class="token punctuation">}</span> x <span class="token operator">=</span> <span class="token punctuation">{</span> <span class="token function">x</span> <span class="token punctuation">(</span> item <span class="token punctuation">.</span> label <span class="token punctuation">)</span> <span class="token operator">-</span> <span class="token constant">GRAPH_BAR_WIDTH</span> <span class="token operator">/</span> <span class="token number">2</span> <span class="token punctuation">}</span> y <span class="token operator">=</span> <span class="token punctuation">{</span> <span class="token function">y</span> <span class="token punctuation">(</span> item <span class="token punctuation">.</span> value <span class="token punctuation">)</span> <span class="token operator">*</span> <span class="token operator">-</span> <span class="token number">1</span> <span class="token punctuation">}</span> rx <span class="token operator">=</span> <span class="token punctuation">{</span> <span class="token number">2.5</span> <span class="token punctuation">}</span> width <span class="token operator">=</span> <span class="token punctuation">{</span> <span class="token constant">GRAPH_BAR_WIDTH</span> <span class="token punctuation">}</span> height <span class="token operator">=</span> <span class="token punctuation">{</span> <span class="token function">y</span> <span class="token punctuation">(</span> item <span class="token punctuation">.</span> value <span class="token punctuation">)</span> <span class="token punctuation">}</span> fill <span class="token operator">=</span> <span class="token punctuation">{</span> colors <span class="token punctuation">.</span> bars <span class="token punctuation">}</span> <span class="token operator">/</span> <span class="token operator">></span> <span class="token punctuation">)</span> <span class="token punctuation">)</span> <span class="token punctuation">}</span> <span class="token punctuation">{</span> <span class="token comment">/* bottom axis */</span> <span class="token punctuation">}</span> <span class="token operator"><</span> Line x1 <span class="token operator">=</span> <span class="token string">"0"</span> y1 <span class="token operator">=</span> <span class="token string">"2"</span> x2 <span class="token operator">=</span> <span class="token punctuation">{</span> graphWidth <span class="token punctuation">}</span> y2 <span class="token operator">=</span> <span class="token string">"2"</span> stroke <span class="token operator">=</span> <span class="token punctuation">{</span> colors <span class="token punctuation">.</span> axis <span class="token punctuation">}</span> strokeWidth <span class="token operator">=</span> <span class="token string">"0.5"</span> <span class="token operator">/</span> <span class="token operator">></span> <span class="token operator"><</span> <span class="token operator">/</span> <span class="token constant">G</span> <span class="token operator">></span> <span class="token operator"><</span> <span class="token operator">/</span> Svg <span class="token operator">></span> <span class="token punctuation">)</span> <span class="token punctuation">;</span> <span class="token punctuation">}</span> <span class="token punctuation">}</span> |
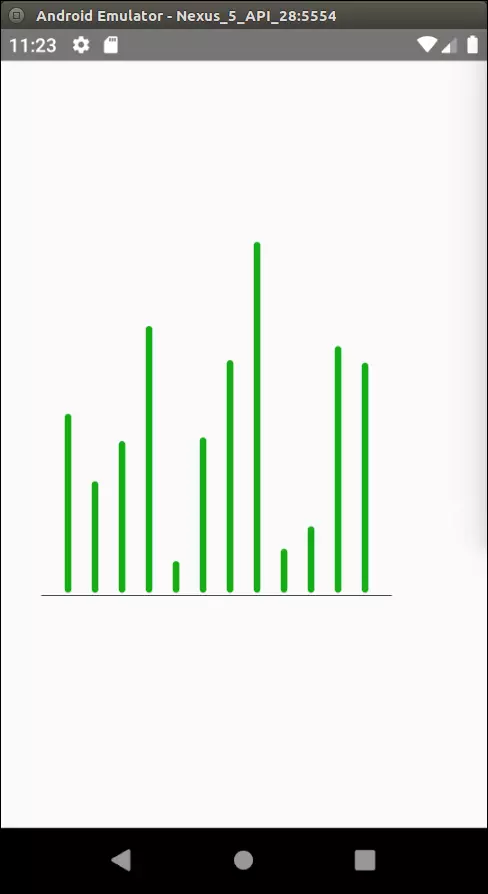
With the above two files, we have created the following chart:
Add a few more details
We will add some details to our current component. We will draw two lines: a line at the top, a line in the middle. We will also add a label above the top row that represents the rounded value of the highest value with the unit and add the label below the column. So we need to add two new prop round and unit for <BarChart> .
Our code will eventually look like this:
1 | <span class="token keyword">import</span> React <span class="token keyword">from</span> <span class="token string">'react'</span> <span class="token punctuation">;</span> <span class="token keyword">import</span> <span class="token punctuation">{</span> StyleSheet <span class="token punctuation">,</span> View <span class="token punctuation">}</span> <span class="token keyword">from</span> <span class="token string">'react-native'</span> <span class="token punctuation">;</span> <span class="token keyword">import</span> BarChart <span class="token keyword">from</span> <span class="token string">'./Components/BarChart'</span> <span class="token punctuation">;</span> <span class="token keyword">const</span> <span class="token function-variable function">App</span> <span class="token operator">=</span> <span class="token punctuation">(</span> <span class="token punctuation">)</span> <span class="token operator">=></span> <span class="token punctuation">{</span> <span class="token keyword">const</span> data <span class="token operator">=</span> <span class="token punctuation">[</span> <span class="token punctuation">{</span> label <span class="token punctuation">:</span> <span class="token string">'Jan'</span> <span class="token punctuation">,</span> value <span class="token punctuation">:</span> <span class="token number">500</span> <span class="token punctuation">}</span> <span class="token punctuation">,</span> <span class="token punctuation">{</span> label <span class="token punctuation">:</span> <span class="token string">'Feb'</span> <span class="token punctuation">,</span> value <span class="token punctuation">:</span> <span class="token number">312</span> <span class="token punctuation">}</span> <span class="token punctuation">,</span> <span class="token punctuation">{</span> label <span class="token punctuation">:</span> <span class="token string">'Mar'</span> <span class="token punctuation">,</span> value <span class="token punctuation">:</span> <span class="token number">424</span> <span class="token punctuation">}</span> <span class="token punctuation">,</span> <span class="token punctuation">{</span> label <span class="token punctuation">:</span> <span class="token string">'Apr'</span> <span class="token punctuation">,</span> value <span class="token punctuation">:</span> <span class="token number">745</span> <span class="token punctuation">}</span> <span class="token punctuation">,</span> <span class="token punctuation">{</span> label <span class="token punctuation">:</span> <span class="token string">'May'</span> <span class="token punctuation">,</span> value <span class="token punctuation">:</span> <span class="token number">89</span> <span class="token punctuation">}</span> <span class="token punctuation">,</span> <span class="token punctuation">{</span> label <span class="token punctuation">:</span> <span class="token string">'Jun'</span> <span class="token punctuation">,</span> value <span class="token punctuation">:</span> <span class="token number">434</span> <span class="token punctuation">}</span> <span class="token punctuation">,</span> <span class="token punctuation">{</span> label <span class="token punctuation">:</span> <span class="token string">'Jul'</span> <span class="token punctuation">,</span> value <span class="token punctuation">:</span> <span class="token number">650</span> <span class="token punctuation">}</span> <span class="token punctuation">,</span> <span class="token punctuation">{</span> label <span class="token punctuation">:</span> <span class="token string">'Aug'</span> <span class="token punctuation">,</span> value <span class="token punctuation">:</span> <span class="token number">980</span> <span class="token punctuation">}</span> <span class="token punctuation">,</span> <span class="token punctuation">{</span> label <span class="token punctuation">:</span> <span class="token string">'Sep'</span> <span class="token punctuation">,</span> value <span class="token punctuation">:</span> <span class="token number">123</span> <span class="token punctuation">}</span> <span class="token punctuation">,</span> <span class="token punctuation">{</span> label <span class="token punctuation">:</span> <span class="token string">'Oct'</span> <span class="token punctuation">,</span> value <span class="token punctuation">:</span> <span class="token number">186</span> <span class="token punctuation">}</span> <span class="token punctuation">,</span> <span class="token punctuation">{</span> label <span class="token punctuation">:</span> <span class="token string">'Nov'</span> <span class="token punctuation">,</span> value <span class="token punctuation">:</span> <span class="token number">689</span> <span class="token punctuation">}</span> <span class="token punctuation">,</span> <span class="token punctuation">{</span> label <span class="token punctuation">:</span> <span class="token string">'Dec'</span> <span class="token punctuation">,</span> value <span class="token punctuation">:</span> <span class="token number">643</span> <span class="token punctuation">}</span> <span class="token punctuation">,</span> <span class="token punctuation">]</span> <span class="token punctuation">;</span> <span class="token keyword">return</span> <span class="token punctuation">(</span> <span class="token operator"><</span> View style <span class="token operator">=</span> <span class="token punctuation">{</span> styles <span class="token punctuation">.</span> container <span class="token punctuation">}</span> <span class="token operator">></span> <span class="token operator"><</span> BarChart data <span class="token operator">=</span> <span class="token punctuation">{</span> data <span class="token punctuation">}</span> round <span class="token operator">=</span> <span class="token punctuation">{</span> <span class="token number">100</span> <span class="token punctuation">}</span> unit <span class="token operator">=</span> <span class="token string">"€"</span> <span class="token operator">/</span> <span class="token operator">></span> <span class="token comment">// modified</span> <span class="token operator"><</span> <span class="token operator">/</span> View <span class="token operator">></span> <span class="token punctuation">)</span> <span class="token punctuation">;</span> <span class="token punctuation">}</span> <span class="token punctuation">;</span> <span class="token keyword">const</span> styles <span class="token operator">=</span> StyleSheet <span class="token punctuation">.</span> <span class="token function">create</span> <span class="token punctuation">(</span> <span class="token punctuation">{</span> container <span class="token punctuation">:</span> <span class="token punctuation">{</span> flex <span class="token punctuation">:</span> <span class="token number">1</span> <span class="token punctuation">,</span> justifyContent <span class="token punctuation">:</span> <span class="token string">'center'</span> <span class="token punctuation">,</span> alignItems <span class="token punctuation">:</span> <span class="token string">'center'</span> <span class="token punctuation">,</span> <span class="token punctuation">}</span> <span class="token punctuation">,</span> <span class="token punctuation">}</span> <span class="token punctuation">)</span> <span class="token punctuation">;</span> <span class="token keyword">export</span> <span class="token keyword">default</span> App <span class="token punctuation">;</span> |
1 | <span class="token keyword">import</span> React <span class="token punctuation">,</span> <span class="token punctuation">{</span> PureComponent <span class="token punctuation">}</span> <span class="token keyword">from</span> <span class="token string">'react'</span> <span class="token punctuation">;</span> <span class="token keyword">import</span> <span class="token punctuation">{</span> Svg <span class="token punctuation">,</span> <span class="token constant">G</span> <span class="token punctuation">,</span> Line <span class="token punctuation">,</span> Rect <span class="token punctuation">,</span> Text <span class="token punctuation">}</span> <span class="token keyword">from</span> <span class="token string">'react-native-svg'</span> <span class="token punctuation">;</span> <span class="token comment">// modified</span> <span class="token keyword">import</span> <span class="token operator">*</span> <span class="token keyword">as</span> d3 <span class="token keyword">from</span> <span class="token string">'d3'</span> <span class="token punctuation">;</span> <span class="token keyword">const</span> <span class="token constant">GRAPH_MARGIN</span> <span class="token operator">=</span> <span class="token number">20</span> <span class="token punctuation">;</span> <span class="token keyword">const</span> <span class="token constant">GRAPH_BAR_WIDTH</span> <span class="token operator">=</span> <span class="token number">5</span> <span class="token punctuation">;</span> <span class="token keyword">const</span> colors <span class="token operator">=</span> <span class="token punctuation">{</span> axis <span class="token punctuation">:</span> <span class="token string">'black'</span> <span class="token punctuation">,</span> bars <span class="token punctuation">:</span> <span class="token string">'#15AD13'</span> <span class="token punctuation">,</span> <span class="token punctuation">}</span> <span class="token punctuation">;</span> <span class="token keyword">export</span> <span class="token keyword">default</span> <span class="token keyword">class</span> <span class="token class-name">BarChart</span> <span class="token keyword">extends</span> <span class="token class-name">PureComponent</span> <span class="token punctuation">{</span> <span class="token function">render</span> <span class="token punctuation">(</span> <span class="token punctuation">)</span> <span class="token punctuation">{</span> <span class="token comment">// Dimensions</span> <span class="token keyword">const</span> SVGHeight <span class="token operator">=</span> <span class="token number">300</span> <span class="token punctuation">;</span> <span class="token keyword">const</span> SVGWidth <span class="token operator">=</span> <span class="token number">300</span> <span class="token punctuation">;</span> <span class="token keyword">const</span> graphHeight <span class="token operator">=</span> SVGHeight <span class="token operator">-</span> <span class="token number">2</span> <span class="token operator">*</span> <span class="token constant">GRAPH_MARGIN</span> <span class="token punctuation">;</span> <span class="token keyword">const</span> graphWidth <span class="token operator">=</span> SVGWidth <span class="token operator">-</span> <span class="token number">2</span> <span class="token operator">*</span> <span class="token constant">GRAPH_MARGIN</span> <span class="token punctuation">;</span> <span class="token keyword">const</span> <span class="token punctuation">{</span> data <span class="token punctuation">,</span> round <span class="token punctuation">,</span> unit <span class="token punctuation">}</span> <span class="token operator">=</span> <span class="token keyword">this</span> <span class="token punctuation">.</span> props <span class="token punctuation">;</span> <span class="token comment">// modified</span> <span class="token comment">// X scale point</span> <span class="token keyword">const</span> xDomain <span class="token operator">=</span> data <span class="token punctuation">.</span> <span class="token function">map</span> <span class="token punctuation">(</span> <span class="token punctuation">(</span> item <span class="token punctuation">)</span> <span class="token operator">=></span> item <span class="token punctuation">.</span> label <span class="token punctuation">)</span> <span class="token punctuation">;</span> <span class="token keyword">const</span> xRange <span class="token operator">=</span> <span class="token punctuation">[</span> <span class="token number">0</span> <span class="token punctuation">,</span> graphWidth <span class="token punctuation">]</span> <span class="token punctuation">;</span> <span class="token keyword">const</span> x <span class="token operator">=</span> d3 <span class="token punctuation">.</span> <span class="token function">scalePoint</span> <span class="token punctuation">(</span> <span class="token punctuation">)</span> <span class="token punctuation">.</span> <span class="token function">domain</span> <span class="token punctuation">(</span> xDomain <span class="token punctuation">)</span> <span class="token punctuation">.</span> <span class="token function">range</span> <span class="token punctuation">(</span> xRange <span class="token punctuation">)</span> <span class="token punctuation">.</span> <span class="token function">padding</span> <span class="token punctuation">(</span> <span class="token number">1</span> <span class="token punctuation">)</span> <span class="token punctuation">;</span> <span class="token comment">// Y scale linear</span> <span class="token keyword">const</span> maxValue <span class="token operator">=</span> d3 <span class="token punctuation">.</span> <span class="token function">max</span> <span class="token punctuation">(</span> data <span class="token punctuation">,</span> <span class="token punctuation">(</span> d <span class="token punctuation">)</span> <span class="token operator">=></span> d <span class="token punctuation">.</span> value <span class="token punctuation">)</span> <span class="token punctuation">;</span> <span class="token comment">// added</span> <span class="token keyword">const</span> topValue <span class="token operator">=</span> Math <span class="token punctuation">.</span> <span class="token function">ceil</span> <span class="token punctuation">(</span> maxValue <span class="token operator">/</span> round <span class="token punctuation">)</span> <span class="token operator">*</span> round <span class="token punctuation">;</span> <span class="token comment">// added</span> <span class="token keyword">const</span> yDomain <span class="token operator">=</span> <span class="token punctuation">[</span> <span class="token number">0</span> <span class="token punctuation">,</span> topValue <span class="token punctuation">]</span> <span class="token punctuation">;</span> <span class="token comment">// modified</span> <span class="token keyword">const</span> yRange <span class="token operator">=</span> <span class="token punctuation">[</span> <span class="token number">0</span> <span class="token punctuation">,</span> graphHeight <span class="token punctuation">]</span> <span class="token punctuation">;</span> <span class="token keyword">const</span> y <span class="token operator">=</span> d3 <span class="token punctuation">.</span> <span class="token function">scaleLinear</span> <span class="token punctuation">(</span> <span class="token punctuation">)</span> <span class="token punctuation">.</span> <span class="token function">domain</span> <span class="token punctuation">(</span> yDomain <span class="token punctuation">)</span> <span class="token punctuation">.</span> <span class="token function">range</span> <span class="token punctuation">(</span> yRange <span class="token punctuation">)</span> <span class="token punctuation">;</span> <span class="token comment">// top axis and middle axis</span> <span class="token keyword">const</span> middleValue <span class="token operator">=</span> topValue <span class="token operator">/</span> <span class="token number">2</span> <span class="token punctuation">;</span> <span class="token comment">// added</span> <span class="token keyword">return</span> <span class="token punctuation">(</span> <span class="token operator"><</span> Svg width <span class="token operator">=</span> <span class="token punctuation">{</span> SVGWidth <span class="token punctuation">}</span> height <span class="token operator">=</span> <span class="token punctuation">{</span> SVGHeight <span class="token punctuation">}</span> <span class="token operator">></span> <span class="token operator"><</span> <span class="token constant">G</span> y <span class="token operator">=</span> <span class="token punctuation">{</span> graphHeight <span class="token operator">+</span> <span class="token constant">GRAPH_MARGIN</span> <span class="token punctuation">}</span> <span class="token operator">></span> <span class="token comment">// modified</span> <span class="token punctuation">{</span> <span class="token comment">/* Top value label */</span> <span class="token punctuation">}</span> <span class="token operator"><</span> Text <span class="token comment">// added</span> x <span class="token operator">=</span> <span class="token punctuation">{</span> graphWidth <span class="token punctuation">}</span> <span class="token comment">// added</span> textAnchor <span class="token operator">=</span> <span class="token string">"end"</span> <span class="token comment">// added</span> y <span class="token operator">=</span> <span class="token punctuation">{</span> <span class="token function">y</span> <span class="token punctuation">(</span> topValue <span class="token punctuation">)</span> <span class="token operator">*</span> <span class="token operator">-</span> <span class="token number">1</span> <span class="token operator">-</span> <span class="token number">5</span> <span class="token punctuation">}</span> <span class="token comment">// added</span> fontSize <span class="token operator">=</span> <span class="token punctuation">{</span> <span class="token number">12</span> <span class="token punctuation">}</span> <span class="token comment">// added</span> fill <span class="token operator">=</span> <span class="token string">"black"</span> <span class="token comment">// added</span> fillOpacity <span class="token operator">=</span> <span class="token punctuation">{</span> <span class="token number">0.4</span> <span class="token punctuation">}</span> <span class="token comment">// added</span> <span class="token operator">></span> <span class="token comment">// added</span> <span class="token punctuation">{</span> <span class="token template-string"><span class="token string">`</span> <span class="token interpolation"><span class="token interpolation-punctuation punctuation">${</span> topValue <span class="token interpolation-punctuation punctuation">}</span></span> <span class="token interpolation"><span class="token interpolation-punctuation punctuation">${</span> unit <span class="token interpolation-punctuation punctuation">}</span></span> <span class="token string">`</span></span> <span class="token punctuation">}</span> <span class="token comment">// added</span> <span class="token operator"><</span> <span class="token operator">/</span> Text <span class="token operator">></span> <span class="token comment">// added</span> <span class="token punctuation">{</span> <span class="token comment">/* top axis */</span> <span class="token punctuation">}</span> <span class="token operator"><</span> Line <span class="token comment">// added</span> x1 <span class="token operator">=</span> <span class="token string">"0"</span> <span class="token comment">// added</span> y1 <span class="token operator">=</span> <span class="token punctuation">{</span> <span class="token function">y</span> <span class="token punctuation">(</span> topValue <span class="token punctuation">)</span> <span class="token operator">*</span> <span class="token operator">-</span> <span class="token number">1</span> <span class="token punctuation">}</span> <span class="token comment">// added</span> x2 <span class="token operator">=</span> <span class="token punctuation">{</span> graphWidth <span class="token punctuation">}</span> <span class="token comment">// added</span> y2 <span class="token operator">=</span> <span class="token punctuation">{</span> <span class="token function">y</span> <span class="token punctuation">(</span> topValue <span class="token punctuation">)</span> <span class="token operator">*</span> <span class="token operator">-</span> <span class="token number">1</span> <span class="token punctuation">}</span> <span class="token comment">// added</span> stroke <span class="token operator">=</span> <span class="token punctuation">{</span> colors <span class="token punctuation">.</span> axis <span class="token punctuation">}</span> <span class="token comment">// added</span> strokeDasharray <span class="token operator">=</span> <span class="token punctuation">{</span> <span class="token punctuation">[</span> <span class="token number">3</span> <span class="token punctuation">,</span> <span class="token number">3</span> <span class="token punctuation">]</span> <span class="token punctuation">}</span> <span class="token comment">// added</span> strokeWidth <span class="token operator">=</span> <span class="token string">"0.5"</span> <span class="token comment">// added</span> <span class="token operator">/</span> <span class="token operator">></span> <span class="token comment">// added</span> <span class="token punctuation">{</span> <span class="token comment">/* middle axis */</span> <span class="token punctuation">}</span> <span class="token operator"><</span> Line <span class="token comment">// added</span> x1 <span class="token operator">=</span> <span class="token string">"0"</span> <span class="token comment">// added</span> y1 <span class="token operator">=</span> <span class="token punctuation">{</span> <span class="token function">y</span> <span class="token punctuation">(</span> middleValue <span class="token punctuation">)</span> <span class="token operator">*</span> <span class="token operator">-</span> <span class="token number">1</span> <span class="token punctuation">}</span> <span class="token comment">// added</span> x2 <span class="token operator">=</span> <span class="token punctuation">{</span> graphWidth <span class="token punctuation">}</span> <span class="token comment">// added</span> y2 <span class="token operator">=</span> <span class="token punctuation">{</span> <span class="token function">y</span> <span class="token punctuation">(</span> middleValue <span class="token punctuation">)</span> <span class="token operator">*</span> <span class="token operator">-</span> <span class="token number">1</span> <span class="token punctuation">}</span> <span class="token comment">// added</span> stroke <span class="token operator">=</span> <span class="token punctuation">{</span> colors <span class="token punctuation">.</span> axis <span class="token punctuation">}</span> <span class="token comment">// added</span> strokeDasharray <span class="token operator">=</span> <span class="token punctuation">{</span> <span class="token punctuation">[</span> <span class="token number">3</span> <span class="token punctuation">,</span> <span class="token number">3</span> <span class="token punctuation">]</span> <span class="token punctuation">}</span> <span class="token comment">// added</span> strokeWidth <span class="token operator">=</span> <span class="token string">"0.5"</span> <span class="token comment">// added</span> <span class="token operator">/</span> <span class="token operator">></span> <span class="token comment">// added</span> <span class="token punctuation">{</span> <span class="token comment">/* bars */</span> <span class="token punctuation">}</span> <span class="token punctuation">{</span> data <span class="token punctuation">.</span> <span class="token function">map</span> <span class="token punctuation">(</span> <span class="token punctuation">(</span> item <span class="token punctuation">)</span> <span class="token operator">=></span> <span class="token punctuation">(</span> <span class="token operator"><</span> Rect key <span class="token operator">=</span> <span class="token punctuation">{</span> item <span class="token punctuation">.</span> label <span class="token punctuation">}</span> x <span class="token operator">=</span> <span class="token punctuation">{</span> <span class="token function">x</span> <span class="token punctuation">(</span> item <span class="token punctuation">.</span> label <span class="token punctuation">)</span> <span class="token operator">-</span> <span class="token constant">GRAPH_BAR_WIDTH</span> <span class="token operator">/</span> <span class="token number">2</span> <span class="token punctuation">}</span> y <span class="token operator">=</span> <span class="token punctuation">{</span> <span class="token function">y</span> <span class="token punctuation">(</span> item <span class="token punctuation">.</span> value <span class="token punctuation">)</span> <span class="token operator">*</span> <span class="token operator">-</span> <span class="token number">1</span> <span class="token punctuation">}</span> rx <span class="token operator">=</span> <span class="token punctuation">{</span> <span class="token number">2.5</span> <span class="token punctuation">}</span> width <span class="token operator">=</span> <span class="token punctuation">{</span> <span class="token constant">GRAPH_BAR_WIDTH</span> <span class="token punctuation">}</span> height <span class="token operator">=</span> <span class="token punctuation">{</span> <span class="token function">y</span> <span class="token punctuation">(</span> item <span class="token punctuation">.</span> value <span class="token punctuation">)</span> <span class="token punctuation">}</span> fill <span class="token operator">=</span> <span class="token punctuation">{</span> colors <span class="token punctuation">.</span> bars <span class="token punctuation">}</span> <span class="token operator">/</span> <span class="token operator">></span> <span class="token punctuation">)</span> <span class="token punctuation">)</span> <span class="token punctuation">}</span> <span class="token punctuation">{</span> <span class="token comment">/* bottom axis */</span> <span class="token punctuation">}</span> <span class="token operator"><</span> Line x1 <span class="token operator">=</span> <span class="token string">"0"</span> y1 <span class="token operator">=</span> <span class="token string">"2"</span> x2 <span class="token operator">=</span> <span class="token punctuation">{</span> graphWidth <span class="token punctuation">}</span> y2 <span class="token operator">=</span> <span class="token string">"2"</span> stroke <span class="token operator">=</span> <span class="token punctuation">{</span> colors <span class="token punctuation">.</span> axis <span class="token punctuation">}</span> strokeWidth <span class="token operator">=</span> <span class="token string">"0.5"</span> <span class="token operator">/</span> <span class="token operator">></span> <span class="token punctuation">{</span> <span class="token comment">/* labels */</span> <span class="token punctuation">}</span> <span class="token punctuation">{</span> data <span class="token punctuation">.</span> <span class="token function">map</span> <span class="token punctuation">(</span> <span class="token punctuation">(</span> item <span class="token punctuation">)</span> <span class="token operator">=></span> <span class="token punctuation">(</span> <span class="token comment">// added</span> <span class="token operator"><</span> Text <span class="token comment">// added</span> key <span class="token operator">=</span> <span class="token punctuation">{</span> <span class="token template-string"><span class="token string">`label</span> <span class="token interpolation"><span class="token interpolation-punctuation punctuation">${</span> item <span class="token punctuation">.</span> label <span class="token interpolation-punctuation punctuation">}</span></span> <span class="token string">`</span></span> <span class="token punctuation">}</span> <span class="token comment">// added</span> fontSize <span class="token operator">=</span> <span class="token string">"8"</span> <span class="token comment">// added</span> x <span class="token operator">=</span> <span class="token punctuation">{</span> <span class="token function">x</span> <span class="token punctuation">(</span> item <span class="token punctuation">.</span> label <span class="token punctuation">)</span> <span class="token punctuation">}</span> <span class="token comment">// added</span> y <span class="token operator">=</span> <span class="token string">"10"</span> <span class="token comment">// added</span> textAnchor <span class="token operator">=</span> <span class="token string">"middle"</span> <span class="token comment">// added</span> <span class="token operator">></span> <span class="token comment">// added</span> <span class="token punctuation">{</span> item <span class="token punctuation">.</span> label <span class="token punctuation">}</span> <span class="token comment">// added</span> <span class="token operator"><</span> <span class="token operator">/</span> Text <span class="token operator">></span> <span class="token comment">// added</span> <span class="token punctuation">)</span> <span class="token punctuation">)</span> <span class="token punctuation">}</span> <span class="token comment">// added</span> <span class="token operator"><</span> <span class="token operator">/</span> <span class="token constant">G</span> <span class="token operator">></span> <span class="token operator"><</span> <span class="token operator">/</span> Svg <span class="token operator">></span> <span class="token punctuation">)</span> <span class="token punctuation">;</span> <span class="token punctuation">}</span> <span class="token punctuation">}</span> |
On the emulator screen we will get the final result as follows:
There are many things that you can do with D3.js and react-native-svg. Hopefully this small tutorial has helped you to understand the basics and give you the things you need to create beautiful charts for yourself.
Source: https://medium.com/kaliop/make-your-own-svg-graph-with-react-native-svg-and-d3-js-dd0250813313 .