BoxOffice a film magazine was born in 1920 and is a big name in the field of investment, trade and film production.
There is a problem when preparing to build a film is whether this film will bring about profits and about how much? This information is very valuable for investors, because they only know how to pour capital and make profits. Fortunately, thanks to the data available in the past with thousands of movies, plus the sophisticated calculation algorithms in Machine Learning, predicting a movie’s revenue is no longer too difficult.
Linear regression – Linear Regression is the most basic algorithm in Machine Learning. In the first project, we will use this algorithm to predict the turnover of a movie knowing the cost of production.
Lesson 1: Collecting and cleaning data when using Linear Regression
Data collection and pre-processing is an important step before starting to use Machine Learning algorithms, the data without information is lost as bias as input for Linear Regression to help predict at the beginning. out exactly.
Before beginning the first lesson of data collection and cleaning, which is prepared for the Linear Regression algorithm, we will look through the data science workflow.
1. Data science working process
Regardless of which machine learning algorithm you apply to the problem you encounter, we will all have to go through a data science workflow. 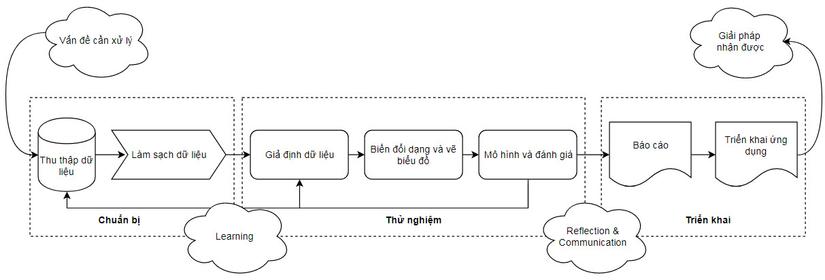 In all projects we will apply this process, although not always all the steps in it. In this process there are 3 stages and lots of steps.
- Stage 1 – Data preparation: Data is collected and cleaned. Most of the original data is in chaotic form, may lack information or falsify information, so it needs to be processed before being included in algorithm models.
- Stage 2 – Testing: at this stage assumptions are made, data is visualized through charts and selection of models.
- Phase 3 – Implementation: Reports, assessments of the application process and results are implemented through real-world applications or simply reports.
When performing the stages, it is possible to go back to the previous stage to prepare better data. This procedure is applicable to real-life tasks, but for the purposes of this article we will take steps to focus on learning.  The steps are condensed as follows:
- Step 1: Form the question
- Step 2: Collect data
- Step 3: Clean the data
- Step 4: Discover and visualize data with charts
- Step 5: Apply algorithms or training models
- Step 6: Evaluate the results
2. The film revenue prediction problem
Before we start dealing with a problem, we should take some time to ask questions like What, Why, How, Where … these questions help us visualize the question. threads. Thanks to these questions, we can determine what kind of data is needed because in reality the amount of data is enormous.
Going back to the problem we are facing in the film revenue prediction problem. Movie investors, they invest in films and are interested in the profits of films. Applying the data science process above, the first step we need to formulate the questions. First question:
“How much money do we need to produce this movie?”
This question is really not good, it’s a little vague. For film investors, they are more interested in profit than cost. Therefore, the question should be:
“How much do we get by producing this movie?”
This question is much better, it has targeted profitability as the criteria investors measure and test investment opportunities. We need to think a bit more, so the factors will depend on what factors? We can list a range of factors:
- Actors are A-list stars?
- Is the script good and famous?
- Does the film use the most modern animation technology?
- Movie promotion expenses
- Does a film director have a market share?
- …
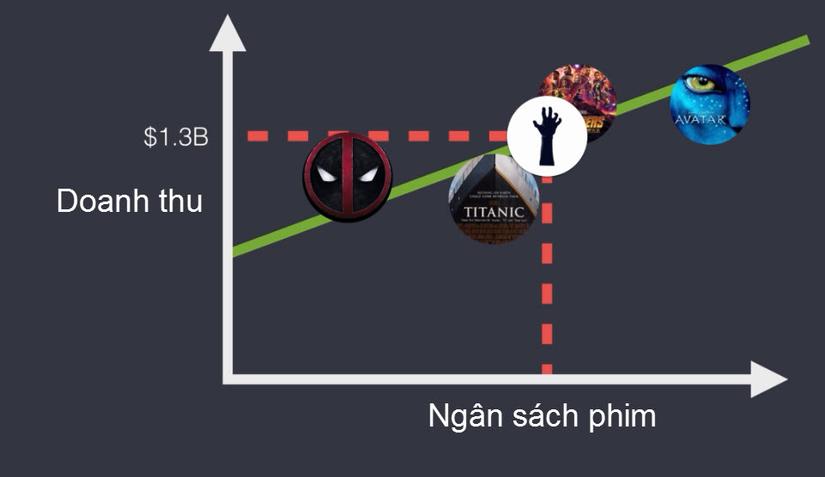
But in general, all of these factors return to the production cost or budget for a movie. As such, we need to find out the production costs of all the films that have been released. Films such as Avatar, Titanic, The Advengers … cost a lot of money, but they also earned huge profits. What does this have to do with the movie we’re about to invest in? If we know how much the film has cost to achieve this revenue, we can predict our movie revenue through the Linear Regression algorithm.
In our problem there are two elements:
- The revenue of the movie is the target to be found.
- Movie budget is feature-independent.
So that we have completed the first step in the project, we have identified the elements (the type of data needed). We will move on to the next step of collecting and cleaning up the data.
3. Film data collection
In the previous section, based on the questions and analysis we knew we needed to have movie revenue and budget data. So where to find this data, fortunately, www.the-numbers.com has all this data. All revenue and budget data in this website is in table format and I have included them in the csv file.
You can download the data in cost_revenue_dirty.csv file to continue the next step of data cleaning.
4. Pre-processing data
Open cost_revenue_dirty.csv file and view the file contents, there is a lot of unusual information, there are films with zero revenue, such as Singularity for example. What is the cause, if you look at the Release Date column (Column B), it turns out that this movie hasn’t been released yet, until December 31, 2020. 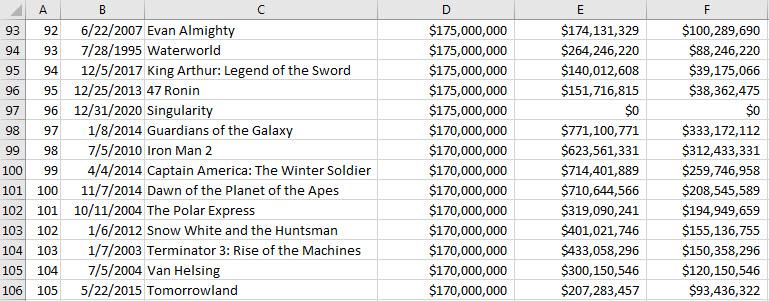
If we filter the films with zero sales, we see a lot of them. But not all of them are unreleased but there are movies that have been completed but haven’t been released due to a lawsuit and many other reasons … So we need to eliminate all of these movies because they are exceptions, it makes our data flawed.
We only need two types of information: film revenue and budget so we only keep the Production Budget () and WorldwideGross () columns. Movie ranking columns, release dates, domestic revenue will be removed. After removing the missing, wrong, incorrectly formatted or unnecessary information, we get the data file after cleaning cost_revenue_clean.csv.
Thus, we have completed 2 of the first 6 steps of finding necessary information and collecting and cleaning data. In the next article we will continue the next step of data mining and data visualization through plotting from acquired data.
5. Related resource articles
- Original data collection cost_revenue_dirty.csv.
- Data file has been processed cost_revenue_clean.csv.