Preamble
Going back to the CSS animation series, this time I decided to learn about SVG. The reason is because I want to create the drawing effect as above, but this one uses images or text are not possible, so I have to use SVG.
Surely, if you ever intended to learn about SVG in html, many people would have a headache when looking at a path that was dizzying, the documents were in English still difficult to understand. Me too, several times trying to find out, gave up, until now I focused on explaining it. The information in this article is compiled from a lot of different sources, each one has a little to be able to fully understand how to draw SVG, and of course it is in Vietnamese, so make sure to help those you want to find. understand SVG shortened the way compared to yourself  .
.
In this article, I will introduce the basics of SVG, how to draw simple SVG, and finally introduce the SVG render tool for fast =))
Introduction to SVG
SVG stands for Scalable Vector Graphics, as the name suggests, it is composed of vectors.
Put simply, the normal image is made up of pixels as squares, when you zoom up, the pixels appear larger, the squares get bigger and your image looks like an 8-bit game. And the vector image is the “direction”, like connecting the line between the two points, so even zoom will not break the bit.
With SVG images, it takes less “space”, is used for icons on the web much lighter than loading images normally (well, unless your SVG images are extremely complicated, then use 1 png optimize file and reduce image quality even more), especially when you want to shrink without losing image quality, like 180p and full HD
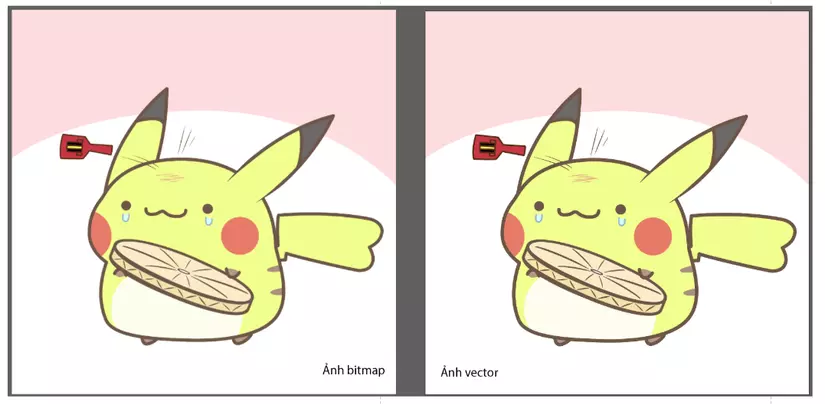
Bit map image and vector image when looking at the same
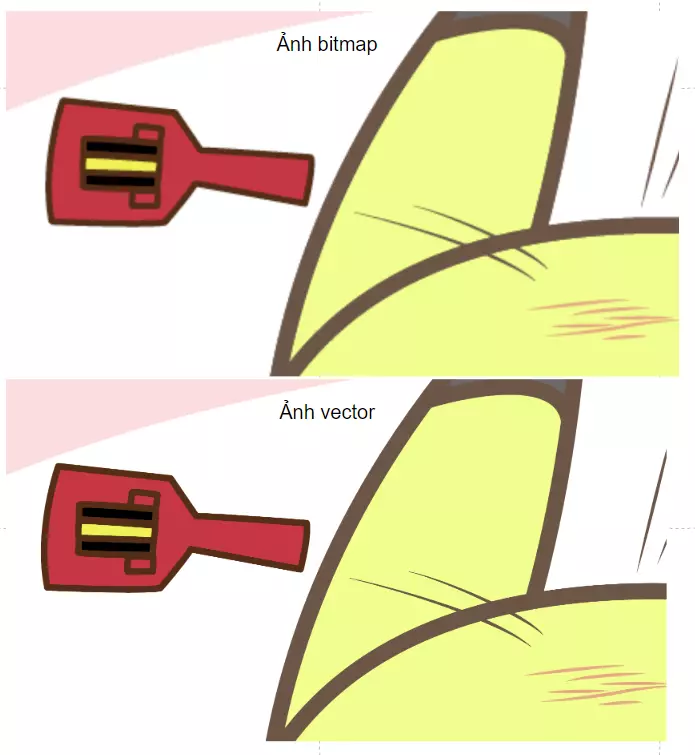
But when zoomed in, the bitmap image is broken, the vector image is not
Everyone can also see this introductory article: https://viblo.asia/p/tim-hieu-ve-svg-gAm5yqd85db
Draw with SVG
Tags
In SVG tags, there may be many child tags, the list of child tags is quite long, you can see all details at https://developer.mozilla.org/en-US/docs/Web/SVG/Element ( Actually, I still can not find out all this crowd). Here I will introduce some cards to create the shape (shape) as follows:
<circle>
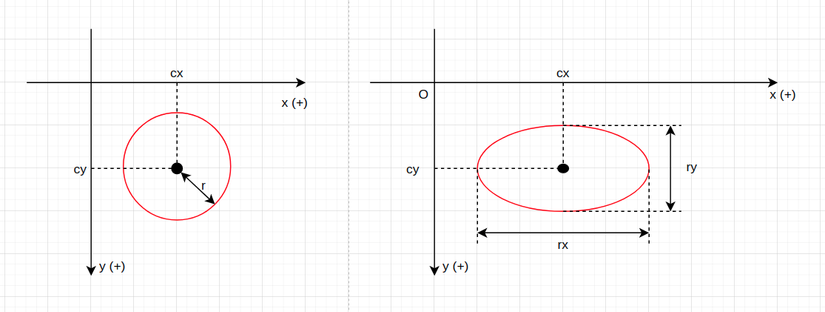
Card drawing circle. This is like using an existing circle and then drawing along, or using a compass. Guaranteed extreme round . The <circle> tag has 3 parameters:
1 2 3 4 | <span class="token tag"><span class="token tag"><span class="token punctuation"><</span> svg</span> <span class="token punctuation">></span></span> <span class="token tag"><span class="token tag"><span class="token punctuation"><</span> circle</span> <span class="token attr-name">cx</span> <span class="token attr-value"><span class="token punctuation">=</span> <span class="token punctuation">"</span> 50 <span class="token punctuation">"</span></span> <span class="token attr-name">cy</span> <span class="token attr-value"><span class="token punctuation">=</span> <span class="token punctuation">"</span> 50 <span class="token punctuation">"</span></span> <span class="token attr-name">r</span> <span class="token attr-value"><span class="token punctuation">=</span> <span class="token punctuation">"</span> 50 <span class="token punctuation">"</span></span> <span class="token attr-name">stroke</span> <span class="token attr-value"><span class="token punctuation">=</span> <span class="token punctuation">"</span> red <span class="token punctuation">"</span></span> <span class="token attr-name">fill</span> <span class="token attr-value"><span class="token punctuation">=</span> <span class="token punctuation">"</span> none <span class="token punctuation">"</span></span> <span class="token punctuation">/></span></span> //stroke để tô màu cho đường, không có nó lại 'invisible' mọi người bảo mình hướng dẫn linh tinh :D <span class="token tag"><span class="token tag"><span class="token punctuation"></</span> svg</span> <span class="token punctuation">></span></span> |
In which: cx , cy is the center of the circle in the direction of x, y (Please review the system x, y in html here ); And r of course is the radius of the circle in pixels
<ellipse>
Card drawing elliptical lines. Like the circle, however, the ellipse has more than 1 param:
1 2 3 4 | <span class="token tag"><span class="token tag"><span class="token punctuation"><</span> svg</span> <span class="token punctuation">></span></span> <span class="token tag"><span class="token tag"><span class="token punctuation"><</span> ellipse</span> <span class="token attr-name">cx</span> <span class="token attr-value"><span class="token punctuation">=</span> <span class="token punctuation">"</span> 100 <span class="token punctuation">"</span></span> <span class="token attr-name">cy</span> <span class="token attr-value"><span class="token punctuation">=</span> <span class="token punctuation">"</span> 50 <span class="token punctuation">"</span></span> <span class="token attr-name">rx</span> <span class="token attr-value"><span class="token punctuation">=</span> <span class="token punctuation">"</span> 100 <span class="token punctuation">"</span></span> <span class="token attr-name">ry</span> <span class="token attr-value"><span class="token punctuation">=</span> <span class="token punctuation">"</span> 50 <span class="token punctuation">"</span></span> <span class="token attr-name">stroke</span> <span class="token attr-value"><span class="token punctuation">=</span> <span class="token punctuation">"</span> red <span class="token punctuation">"</span></span> <span class="token attr-name">fill</span> <span class="token attr-value"><span class="token punctuation">=</span> <span class="token punctuation">"</span> none <span class="token punctuation">"</span></span> <span class="token punctuation">/></span></span> <span class="token tag"><span class="token tag"><span class="token punctuation"></</span> svg</span> <span class="token punctuation">></span></span> |
Because the ellipse has 2 focal points (this was learned in grade 3), so instead of just having a radius r like a circle, we have rx , and ry . You can search for more ellipses to practice drawing
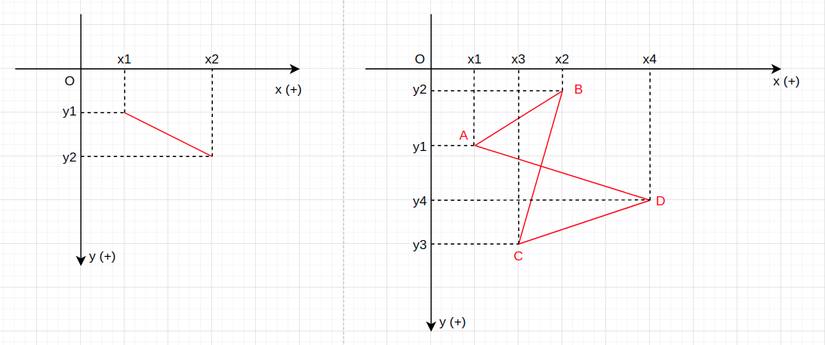
<line>
Card drawing straight lines. And to draw a straight line, you need to know the starting position and the ending position, so there will be 4 params here:
1 2 3 4 | <span class="token tag"><span class="token tag"><span class="token punctuation"><</span> svg</span> <span class="token punctuation">></span></span> <span class="token tag"><span class="token tag"><span class="token punctuation"><</span> line</span> <span class="token attr-name">x1</span> <span class="token attr-value"><span class="token punctuation">=</span> <span class="token punctuation">"</span> 0 <span class="token punctuation">"</span></span> <span class="token attr-name">y1</span> <span class="token attr-value"><span class="token punctuation">=</span> <span class="token punctuation">"</span> 80 <span class="token punctuation">"</span></span> <span class="token attr-name">x2</span> <span class="token attr-value"><span class="token punctuation">=</span> <span class="token punctuation">"</span> 100 <span class="token punctuation">"</span></span> <span class="token attr-name">y2</span> <span class="token attr-value"><span class="token punctuation">=</span> <span class="token punctuation">"</span> 20 <span class="token punctuation">"</span></span> <span class="token attr-name">stroke</span> <span class="token attr-value"><span class="token punctuation">=</span> <span class="token punctuation">"</span> red <span class="token punctuation">"</span></span> <span class="token attr-name">fill</span> <span class="token attr-value"><span class="token punctuation">=</span> <span class="token punctuation">"</span> none <span class="token punctuation">"</span></span> <span class="token punctuation">/></span></span> <span class="token tag"><span class="token tag"><span class="token punctuation"></</span> svg</span> <span class="token punctuation">></span></span> |
x1 , y1 are the x, y coordinates of the starting point, and x2 , y2 are the coordinates of the ending point.
<polygon>
Card drawing polygons. With this tab, you will define the points as vertices of the polygon, and will connect the points in the order you write and then automatically connect the last point to the starting point to create a closed shape.
1 2 3 4 | <span class="token tag"><span class="token tag"><span class="token punctuation"><</span> svg</span> <span class="token punctuation">></span></span> <span class="token tag"><span class="token tag"><span class="token punctuation"><</span> polygon</span> <span class="token attr-name">points</span> <span class="token attr-value"><span class="token punctuation">=</span> <span class="token punctuation">"</span> 0,100 50,25 50,75 100,0 <span class="token punctuation">"</span></span> <span class="token attr-name">stroke</span> <span class="token attr-value"><span class="token punctuation">=</span> <span class="token punctuation">"</span> red <span class="token punctuation">"</span></span> <span class="token attr-name">fill</span> <span class="token attr-value"><span class="token punctuation">=</span> <span class="token punctuation">"</span> none <span class="token punctuation">"</span></span> <span class="token punctuation">/></span></span> <span class="token tag"><span class="token tag"><span class="token punctuation"></</span> svg</span> <span class="token punctuation">></span></span> |
In attribute points is the list of coordinate pairs of each polygon vertex.
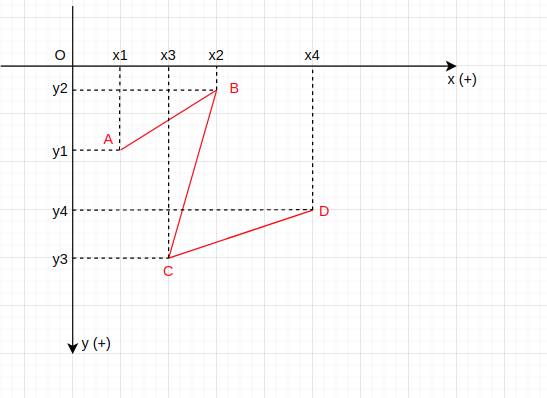
<polyline>
Card draw broken lines. This tag will define pairs of coordinates of points, and then connect the points together in a straight line in order. It is not much different from a polygon, except that it does not connect the end point to the beginning .
1 2 3 4 | <span class="token tag"><span class="token tag"><span class="token punctuation"><</span> svg</span> <span class="token punctuation">></span></span> <span class="token tag"><span class="token tag"><span class="token punctuation"><</span> polyline</span> <span class="token attr-name">points</span> <span class="token attr-value"><span class="token punctuation">=</span> <span class="token punctuation">"</span> 100,100 150,25 150,75 200,0 <span class="token punctuation">"</span></span> <span class="token attr-name">fill</span> <span class="token attr-value"><span class="token punctuation">=</span> <span class="token punctuation">"</span> none <span class="token punctuation">"</span></span> <span class="token attr-name">stroke</span> <span class="token attr-value"><span class="token punctuation">=</span> <span class="token punctuation">"</span> black <span class="token punctuation">"</span></span> <span class="token punctuation">/></span></span> <span class="token tag"><span class="token tag"><span class="token punctuation"></</span> svg</span> <span class="token punctuation">></span></span> |
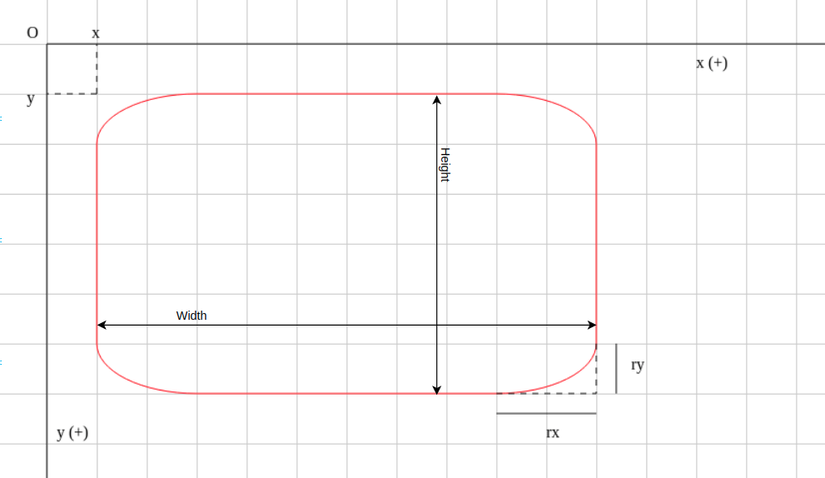
<react>
Draw a rectangle. With this card, in addition to drawing regular 4-pointed rectangle, you can also add corners to the shape:
1 2 3 4 | <span class="token tag"><span class="token tag"><span class="token punctuation"><</span> svg</span> <span class="token punctuation">></span></span> <span class="token tag"><span class="token tag"><span class="token punctuation"><</span> rect</span> <span class="token attr-name">x</span> <span class="token attr-value"><span class="token punctuation">=</span> <span class="token punctuation">"</span> 120 <span class="token punctuation">"</span></span> <span class="token attr-name">y</span> <span class="token attr-value"><span class="token punctuation">=</span> <span class="token punctuation">"</span> 60 <span class="token punctuation">"</span></span> <span class="token attr-name">width</span> <span class="token attr-value"><span class="token punctuation">=</span> <span class="token punctuation">"</span> 200 <span class="token punctuation">"</span></span> <span class="token attr-name">height</span> <span class="token attr-value"><span class="token punctuation">=</span> <span class="token punctuation">"</span> 100 <span class="token punctuation">"</span></span> <span class="token attr-name">rx</span> <span class="token attr-value"><span class="token punctuation">=</span> <span class="token punctuation">"</span> 15 <span class="token punctuation">"</span></span> <span class="token punctuation">/></span></span> <span class="token tag"><span class="token tag"><span class="token punctuation"></</span> svg</span> <span class="token punctuation">></span></span> |
Here, x , y are the top left coordinates. width is the width of the rectangle, height is the height of the rectangle. To add an angle to the image, you can use 2 more parameters rx and ry . If only rx was written, the default will be rx = ry . rx is the width of the rounded line, ry is the height of the rounded line. Please refer to the illustration below to visualize better:
<path>
Line drawing card. This is the most flexible card, able to draw everything with this card, like drawing with your hands. And of course, if you know how to use it, you can use this card to draw the pictures above, but that will not be as simple as using such cards directly. . Because of this flexibility, this is the most complex card to learn. I gave up many times to find out because I was having a headache, but the documents read, read a lot of confusion, so I dropped it a few times. . Now I am determined to come back and find some more understandable material.
<path> does not have the attributes x , y , points like the above tags, but only the main attribute d represents the word ‘data’ (of course there are normal attributes like style , class , id , … like other tags). And inside this d is this complexity. To draw lines, all the information used to draw will be placed in this d card
1 2 3 4 5 6 | <span class="token tag"><span class="token tag"><span class="token punctuation"><</span> path</span> <span class="token attr-name">d</span> <span class="token attr-value"><span class="token punctuation">=</span> <span class="token punctuation">"</span> M 10,30 A 20,20 0 0,1 50,30 A 20,20 0 0,1 90,30 Q 90,60 50,90 Q 10,60 10,30 z <span class="token punctuation">"</span></span> <span class="token punctuation">/></span></span> |
Inside this attribute d has the following main elements (note that this is still a solid line, that is, the previous point connects the following point, draw without lifting the pen until the last point: the end point is the start point first Draw the following guy):
- M – move to: This is the starting point for placing the brush, followed by the pair of coordinates for this pen location.
1 2 3 | M[point-x],[point-y] VD: 'M282,360' |
- L: stands for ‘Line’, followed by a pair of coordinates, meaning that from the previous point draw a line to the point with the coordinates associated.
1 2 3 | L[endPoint-x],[endPoint-y] VD: 'L30,60' |
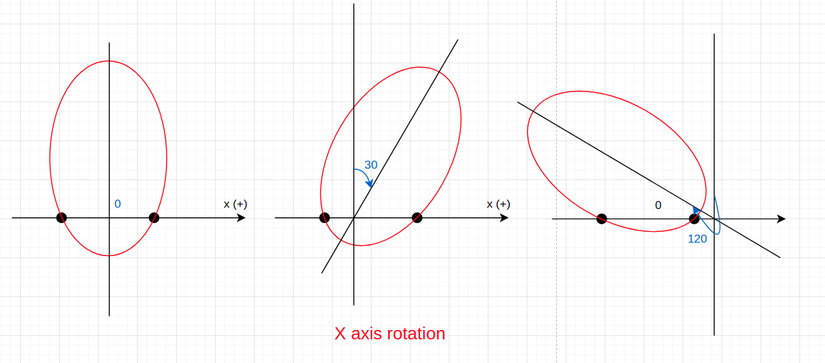
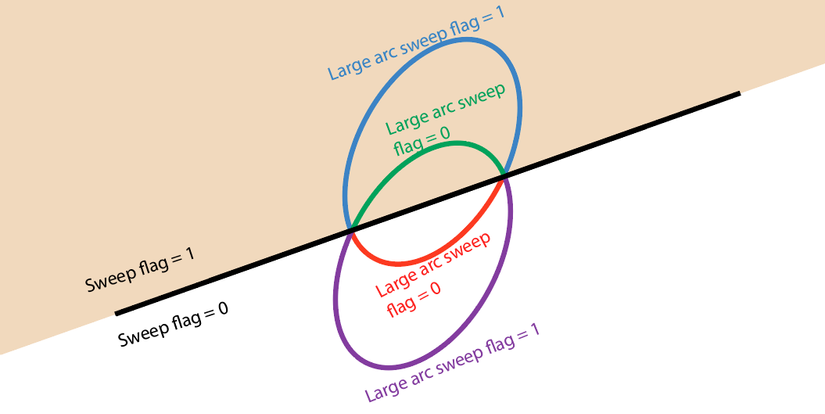
- A: Arcs – Draw an ellipse. Followed by 4 sets of parameters separated by
space: For example:A 20,20 0 0,1 50,30(there may be different spellings for these parameter pairs, but I write in pairs of commas for ease of analysis. )- The first pair: in order of
X radiusandY radius, ifX radius = Y radiusit will be the arc of the circle, and if the two parameters are different, it will be the arc of the ellipse.reactthereactimage shown above,X radius(rx) is the height of the curve. In fact, this is an angle of the ellipse drawn with ellipse height =2ry, ellipse width =2rx. Thus, the first pair will define the ellipse with ellipse height =2 * Y radiusand width =2 * X radius - The next parameter is
x-axis-rotation. Used to determine where the arc has two starting and ending points on the ellipse, can also be understood as rotating ellipse types, and it cuts the Ox axis at both the start and end points when spinning. how many degree. (The unit of course is the unit of measure of angle: degree).
- Next pair of parameters: Decide whether to draw a large arc or a small arc of an ellipse, draw a convex or concave arc. Each parameter will take 2 values: 0 or 1. The first parameter: ‘Large arc sweep flag’. This means selecting a large arc or a small arc: 0 for a small arc, 1 for a large arc. The second parameter: ‘Sweep flag’. This parameter selects whether the arc will be ‘convex’ or ‘concave’ – or it is conceivable that much of the area of the ellipse will be above or below: 0 is the ellipse that is largely ‘sunken’, and 1 is an ellipse with bigger than ’emerging’.
- The last pair of parameters: determines the end of the ellipse. The beginning of the ellipse is determined by the end of the previous figure, so the end of this ellipse will also be the starting point of the next shape.
- The first pair: in order of
1 2 3 | A[X-radius],[Y-radius] [x-axis-rotation] [large arc sweep flag],[sweep flag] [endPoint-x],[endPoint-y] VD: 'A20,20 0 0,1 50,30' |
- Q: Draw a quadratic curve – Quadratic Bezier Curves. This line is used to connect 2 points 1 “smooth” when there is 1 focus. With Q, you will define two params: the first parameter pair is the focal point, the second parameter pair is the end point coordinates of the figure. With a defined focus and two start points and an end point, we will draw two lines intersecting each other at the focus. To explain in words is quite long, please read the article http://www.svgbasics.com/curves.html to understand this Quadratic Bezier Curves. In addition, you can read this article and practice it (very useful for understanding the next C element): http://apex.infogridpacific.com/SVG/svg-tutorial-lesson18-path-quadratics .html
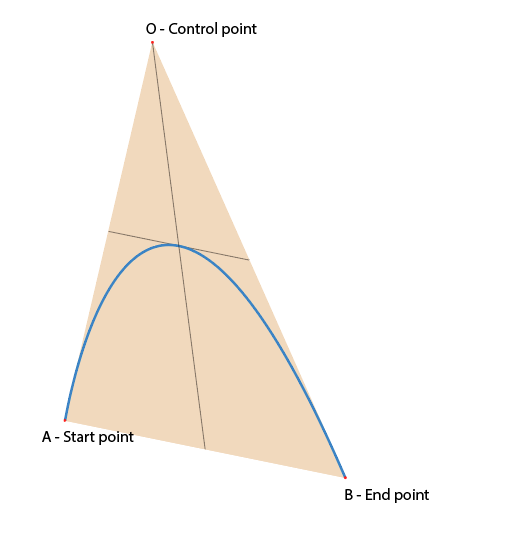
1 2 3 | Q[controlPoint-x],[controlPoint-y] [endPoint-x],[endPoint-y] VD: 'Q90,60 90,50' |
- C: Cubic Bezier Curves – curve 2 control point. Q curve only has 1 control point to create a curve lying completely on one side like the other, then C has 2 control points, it can create a curve located in 2 half planes created by 2 end points. Each start point and end point will have a corresponding control point to control the shape. Each control point is like a magnet, and the line is a rubber band attached to the iron particles on the wire. If the control point is far away, the elastic will stretch and head towards it. If you’ve ever used the pen tool in photoshop or Adobe tools, you’ll find it is the anchor point. Anyone who is familiar with pentool will use this C line master, I don’t need any instructions . Pentool is also something that can draw anything, so does C .
Draw shapes with control points
When two control points are on a straight line, the resulting C line is also a straight line.
Road C has 3 pairs of parameters: The first pair is the Control point coordinates of the start point, the next pair is the control point coordinates of the end point, and finally the end point coordinates.
1 2 3 | C[controlStartPoint-x],[controlStartPoint-y] [controlEndPoint-x],[controlEndPoint-y] [endPoint-x],[endPoint1-y] VD: 'C3,63 61,5 121,5' |
To use the C line is quite complex, need to identify the approximate points, so if you can use the pen drawing tool in graphics, you can draw yourself, if not … curious
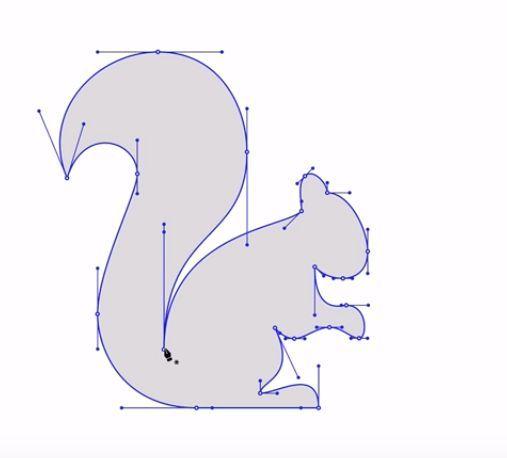
Below is a picture I drew using the Adobe Illustrator pen tool to draw according to the control point creation as the squirrel, by the grid to easily determine the point of drawing by svg (1 small box = 5px, 1 large box = 70px)
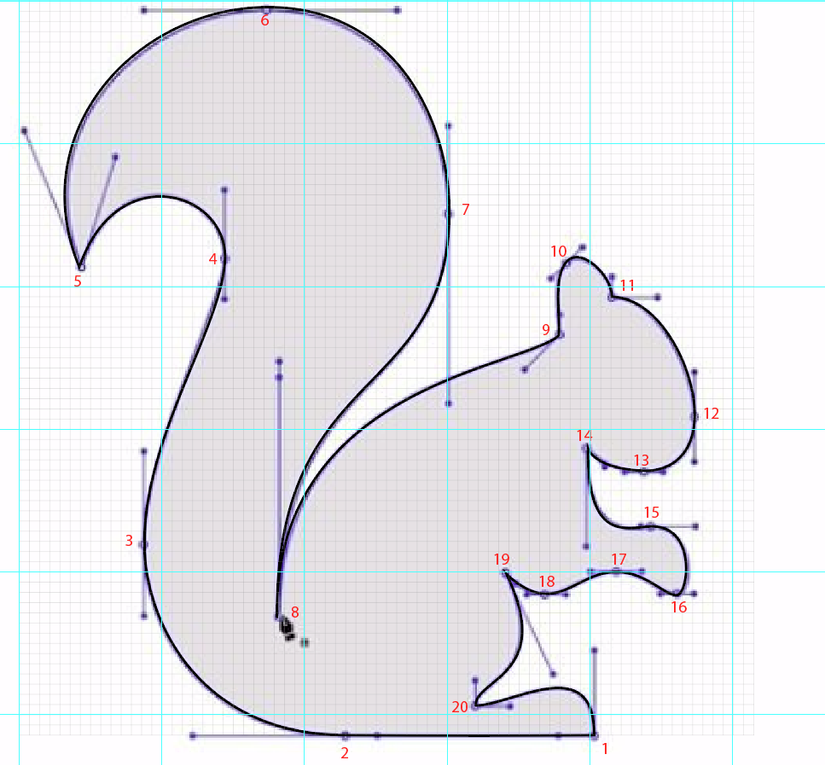
And here is the result after analyzing the coordinates of the points: https://codepen.io/bunnypi04/pen/jObqxRX
(I drew more grid with JS to make it easy for people to visualize and determine the coordinates)
Because only the
<path>tag withd– data can draw all shapes, so I’ll just introduce the tags here. (In my experience drawing lots of images with Adobe Illustrator, I say so
Summary of Path Command
Below is a list of commands to draw for path data. Each command is denoted by a letter, followed by a set of parameters. The uppercase letters will interpret the coordinates in the usual xOy coordinate system (ie, from the top left corner of the SVG object including the origin of the coordinate – Absolute position), while the lowercase letter will has the same command function but with the interpretation of coordinates with the origin as the endPoint immediately preceding (relative position). Assuming the original coordinates O of the SVG object: the point M has the coordinates 5, 5; point N has the coordinates 15,15; then the absolute position of N is 15, 15 (because of the origin); and the relative position of N when M is its starting point is 10, 10.
| Command | Params | Name | Information |
|---|---|---|---|
| M | x, y | move to | Move to point x, y without drawing a line |
| m | x, y | move to | Same as above, but x, y have the origin of the previous stop |
| L | x, y | line to | Draw a line to the point x, y |
| l (small L, not i in capital letters) | x, y | line to | Also draw a line, but the points x, yx, y whose origin is the pen stop before |
| H | x | horizontal line to | Draw a horizontal line from the previous pen stop (parallel to Ox) to the intersection with the line y = x |
| H | x | horizontal line to | Draw a horizontal line from the previous pen stop (parallel to Ox) to the intersection with the line y = x-params but the origin is the pen stop before |
| V | y | vertical line to | Draw a vertical line from the previous pen stop (parallel to Oy) to the intersection with the line x = y-params. |
| v | y | vertical line to | Draw a vertical line from the previous pen stop (parallel to Oy) to the intersection with the line x = y-params but the origin is the previous pen stop. |
| C | x1, y1 x2, y2 x, y | curveto | Draw a curve to the point (x, y) with the Start point control (x1, y1) and the Control end point as (x2, y2) |
| C | x1, y1 x2, y2 x, y | curveto | Same as above, but the origin is the previous pen stop |
| S | x2, y2 x, y | curveto shorthand | (Abbreviated) Draw a curve C to the point (x1, y1) with the Start point control coinciding with the control point End point of the previous line, while the control End point is (x2, y2). |
| S | x2, y2 x, y | shorthand | Same as above, but the origin is the previous pen stop |
| Q | x1, y1 x, y | quadratic Bezier curveto | Draw a quadratic Bezier curve to a point (x, y) with a control point being a point (x1, y1) |
| Q | x1, y1 x, y | quadratic Bezier curveto | Same as above, but the origin is the previous pen stop |
| T | x, y | quadratic Bezier curveto shorthand | Draw a line Q but the control point coincides with the last control point of the line drawn before it. |
| t | x, y | quadratic Bezier curveto shorthand | Same as above, but the origin is the previous pen stop |
| A | rx, ry x-axis-rotation large-arc-flag, sweepflag x, y | elliptical arc | Draw an ellipse curve with the line ending point (x, y), where rx, ry are the length and width of the ellipse, respectively, the x-axis-rotation is the inclination compared to the original image, the large-arc-flag is selected. big / small curves, sweepflag to select the plane containing the curve |
| A | rx, ry x-axis-rotation large-arc-flag, sweepflag x, y | elliptical arc | Same as above, but the origin is the previous pen stop |
| Z | no param | closepath | Close the redraw by connecting to the first point of the path, creating a closed shape |
| z | no param | closepath | It is the same thing |
Try practice
I have found a link code pen that is quite useful for understanding the ingredients L, C, Q, A above, please try it here: https://codepen.io/anthonydugois/pen/mewdyZ
Some common attributes of SVG
The full properties of SVG are very long, you can view the full version here . Below I will introduce some commonly used attributes
Stroke
Stroke is a property of your line drawing. The following stroke properties are available:
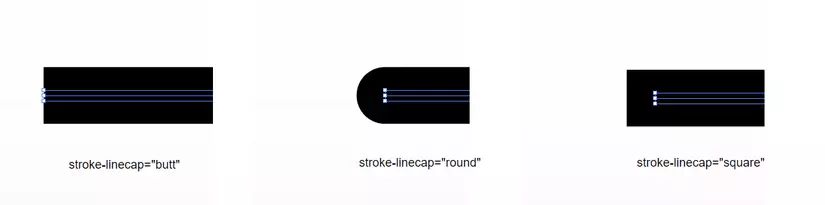
stroke: The color for the stroke. Example:<path stroke="red" d="M5,20 l215,0" />stroke-width: The line thickness. Example:<path stroke="red" stroke-width="2" d="M5,20 l215,0" />stroke-linecap: The end of a stroke. Example:<path stroke-linecap="butt" d="M5,20 l215,0" />
stroke-linejoin: The shape of a kink. Example: https://jsfiddle.net/api/mdn/stroke-dasharray: Stroke. Create a dashed line with the params in turn, the stroke length, followed by the length of the whitespace, and so on. Example: https://www.w3schools.com/graphics/tryit.asp?filename=trysvg_stroke3stroke-opacity: Transparency of brush strokes
Fill
Fill is a property to select colors, fill colors for SVG images, including whether or not the image is closed. Example: <circle cx="150" cy="50" r="40" fill="tomato" /> . There is also fill-opacity to set transparency for colors too.
Opacity
As the name implies, this property determines the transparency for both SVG images, including internal tag elements, and both borders and background colors.
ViewBox
With viewBox , SVG will set limits on what you can see on this SVG image. For example, if you have a sample SVG image, it is quite detailed but you only want to use a small detail on it, but hesitate to analyze the points to remove redundant details (or a complex SVG image, then poke the face). , then you just need to find the location of that spot compared to the original SVG image, that rectangular frame limit appears only, “hide” everything outside the box. The most common application is the SVG Sprites: one set of icons drawn with SVG on an SVG plate, then the icons will be the view box showing only one corresponding icon, the others are hidden. As a result, the web only needs to load one SVG image and use it for all icons instead of each icon loading one image.
Draw effect effect
After learning quite a bit about SVG (of course, it is not enough ), then only with that much can return to the original purpose, that is the drawing effect, and of course the effect does not use JS .
First we need to draw the word. The word moon on it is drawn using all basic strokes, using lines, semi-circular and circular arcs. The resulting SVG image looks like this:
1 2 3 4 5 6 7 8 9 10 11 12 13 14 15 16 | <span class="token tag"><span class="token tag"><span class="token punctuation"><</span> svg</span> <span class="token attr-name">viewBox</span> <span class="token attr-value"><span class="token punctuation">=</span> <span class="token punctuation">"</span> 0 0 1000 1000 <span class="token punctuation">"</span></span> <span class="token punctuation">></span></span> <span class="token tag"><span class="token tag"><span class="token punctuation"><</span> path</span> <span class="token attr-name">d</span> <span class="token attr-value"><span class="token punctuation">=</span> <span class="token punctuation">"</span> M100,300 L100,200 A50,50 0 0,1 200,200 A50,50 0 0,1 300,200 L300,300 <span class="token punctuation">"</span></span> <span class="token attr-name">stroke</span> <span class="token attr-value"><span class="token punctuation">=</span> <span class="token punctuation">"</span> black <span class="token punctuation">"</span></span> <span class="token attr-name">fill</span> <span class="token attr-value"><span class="token punctuation">=</span> <span class="token punctuation">"</span> none <span class="token punctuation">"</span></span> <span class="token punctuation">/></span></span> <span class="token tag"><span class="token tag"><span class="token punctuation"><</span> circle</span> <span class="token attr-name">cx</span> <span class="token attr-value"><span class="token punctuation">=</span> <span class="token punctuation">"</span> 425 <span class="token punctuation">"</span></span> <span class="token attr-name">cy</span> <span class="token attr-value"><span class="token punctuation">=</span> <span class="token punctuation">"</span> 225 <span class="token punctuation">"</span></span> <span class="token attr-name">r</span> <span class="token attr-value"><span class="token punctuation">=</span> <span class="token punctuation">"</span> 75 <span class="token punctuation">"</span></span> <span class="token attr-name">stroke</span> <span class="token attr-value"><span class="token punctuation">=</span> <span class="token punctuation">"</span> black <span class="token punctuation">"</span></span> <span class="token attr-name">fill</span> <span class="token attr-value"><span class="token punctuation">=</span> <span class="token punctuation">"</span> none <span class="token punctuation">"</span></span> <span class="token punctuation">/></span></span> <span class="token tag"><span class="token tag"><span class="token punctuation"><</span> circle</span> <span class="token attr-name">cx</span> <span class="token attr-value"><span class="token punctuation">=</span> <span class="token punctuation">"</span> 625 <span class="token punctuation">"</span></span> <span class="token attr-name">cy</span> <span class="token attr-value"><span class="token punctuation">=</span> <span class="token punctuation">"</span> 225 <span class="token punctuation">"</span></span> <span class="token attr-name">r</span> <span class="token attr-value"><span class="token punctuation">=</span> <span class="token punctuation">"</span> 75 <span class="token punctuation">"</span></span> <span class="token attr-name">stroke</span> <span class="token attr-value"><span class="token punctuation">=</span> <span class="token punctuation">"</span> black <span class="token punctuation">"</span></span> <span class="token attr-name">fill</span> <span class="token attr-value"><span class="token punctuation">=</span> <span class="token punctuation">"</span> none <span class="token punctuation">"</span></span> <span class="token punctuation">/></span></span> <span class="token tag"><span class="token tag"><span class="token punctuation"><</span> path</span> <span class="token attr-name">d</span> <span class="token attr-value"><span class="token punctuation">=</span> <span class="token punctuation">"</span> M750,300 L750,200 A50,50 0 0,1 850,200 L850,300 <span class="token punctuation">"</span></span> <span class="token attr-name">stroke</span> <span class="token attr-value"><span class="token punctuation">=</span> <span class="token punctuation">"</span> black <span class="token punctuation">"</span></span> <span class="token attr-name">fill</span> <span class="token attr-value"><span class="token punctuation">=</span> <span class="token punctuation">"</span> none <span class="token punctuation">"</span></span> <span class="token punctuation">/></span></span> <span class="token tag"><span class="token tag"><span class="token punctuation"></</span> svg</span> <span class="token punctuation">></span></span> |
Now is the good part. How does it run strokes? For effects, of course, the animation will be used. I will choose the animation named draw , the running time is 5s, choose infinite for infinite loop, and linear so that the running speed is like squeezing lemon .
1 2 | <span class="token property">animation</span> <span class="token punctuation">:</span> draw 5s infinite linear <span class="token punctuation">;</span> |
To have each stroke drawn, I cheat a bit, taking advantage of the stroke-dash to create strokes and “transparent strokes”. So, that drawing effect is actually the dash that runs through the text.
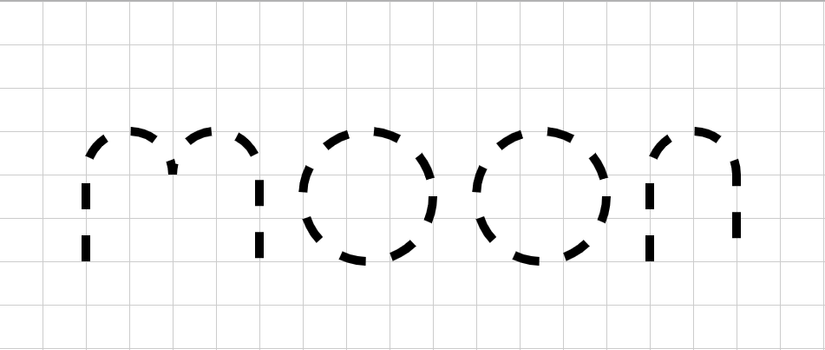
In order for the stroke to be drawn, select the long dash line so that it is longer than the stroke length of each word, with the other image set to 800:
1 2 | <span class="token property">stroke-dasharray</span> <span class="token punctuation">:</span> 800 <span class="token punctuation">;</span> |
But now it will display text and then disappear like strokes, rather than the word “failed to have”, draw the word. So I put one more attribute: stroke-dashoffset to undo the starting point to draw the dash again. Also set to 800 to make sure it flies out of the word . Because I want the effect for each letter, all the child drawn line tags have the same drawing effect:
1 2 3 4 5 6 7 8 9 | <span class="token selector">path, circle</span> <span class="token punctuation">{</span> <span class="token property">stroke-width</span> <span class="token punctuation">:</span> 10px <span class="token punctuation">;</span> <span class="token property">stroke</span> <span class="token punctuation">:</span> black <span class="token punctuation">;</span> <span class="token property">fill</span> <span class="token punctuation">:</span> none <span class="token punctuation">;</span> <span class="token property">stroke-dasharray</span> <span class="token punctuation">:</span> 800 <span class="token punctuation">;</span> <span class="token property">stroke-dashoffset</span> <span class="token punctuation">:</span> 800 <span class="token punctuation">;</span> <span class="token property">animation</span> <span class="token punctuation">:</span> draw 5s infinite linear <span class="token punctuation">;</span> <span class="token punctuation">}</span> |
Finally, run the effect. Now use keyframe to set the dash offset to 0 when the effect expires:
1 2 3 4 5 6 | <span class="token atrule"><span class="token rule">@keyframes</span> draw</span> <span class="token punctuation">{</span> <span class="token selector">to</span> <span class="token punctuation">{</span> <span class="token property">stroke-dashoffset</span> <span class="token punctuation">:</span> 0 <span class="token punctuation">;</span> <span class="token punctuation">}</span> <span class="token punctuation">}</span> |
So now the results are as good as the beginning
Everyone try it here: https://codepen.io/bunnypi04/pen/MWayaam
(I drew more grid with JS to make it easy for people to visualize and determine the coordinates)
SVG application – link
SVG has many uses, such as the icomoon icon set that uses this svg sprites, or the icons on the pages they often use SVG images, you can also create your own icon sets.  . In addition, because the vector preserves the sharpness, which is lighter than the normal image, SVG is also used instead of simple images to reduce the load for the website (except for complex images like I said at the beginning of the article). Some people like me like at least js, but if they like cool things like drawing other words, they also use this to make the site look cooler, without heavy loading of js or video images.
There are a few SVG render tools I can search here . Although not perfect, but can be used as a tool to master this SVG. In addition, you can also export regular images to SVG with the Graphic tool, but then the vector will not preserve the absolute sharpness as when drawing hand. . One way to get SVG code from any SVG image is to open the SVG image file with a code editor, you will get the code of that SVG file, the vector image will produce the most accurate SVG file. .
Hopefully the article will reach the goal of “understanding svg easier” for many new students to learn about SVG