Probably, when using AWS EC2 service, we all want to monitor the used storage, track the amount of ram to see if it meets the current processing. In order for our application running on EC2 to be uninterrupted, receiving alerts when the storage capacity is about to be full or the ram capacity is always at the maximum threshold for a long time from which to make adjustments, Changing resources for EC2 is also a practical requirement.
In this article, I will introduce and guide how to install tools to monitor and warn about storage on Amazon EC2.
1. Cloudwatch

Cloudwatch is a service that monitors cloud resources and applications running on AWS. It helps us collect and track system statistics, from which we can make statistics and allow the setting of alerts according to each specific data.
2. Metric
Metric is a chart that tracks and shows a certain server resources that are being used, such as CPU, RAM, Disk resources … 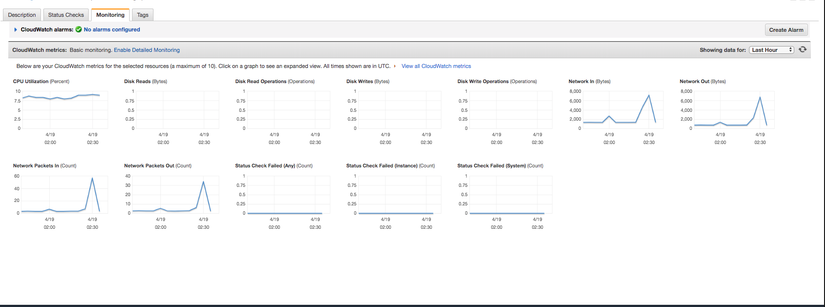
- CPUCreditBalance
- CPUCreditUsage
- CPUUtilization
- DiskReadBytes
- DiskReadOps
- DiskWriteBytes
- DiskWriteOps
- NetworkIn
- NetworkOut
- StatusCheckFailed
- StatusCheckFailed_Instance
- StatusCheckFailed_System
By default when installing an EC2 server, AWS provides us with 12 metrics as shown and the list above, these metrics allow us to monitor CPU status, disk read and write speed, network speed. in and out of the server … However, to monitor and install storage warnings on EC2 then we will need to install additional expansion metrics.
Currently, as far as I know, we can add extended metrics to monitor hard disk usage, ram as follows:
- DiskSpaceAvailable
- DiskSpaceUsed
- DiskSpaceUtilization
- MemoryAvailable
- MemoryUsed
- MemoryUtilization
- SwapUsed
- SwapUtilization
3. Install
I. Perl modules
In some linux versions, we must install additional Perl modules to be able to use the reporting function of memory usage, swap and disk space for a Linux version.
First you need to ssh into EC2 that you are installing with sudo privileges.
For EC2, it’s Amazon Linux 2 and Amazon Linux AMI
1 2 | sudo yum install -y perl-Switch perl-DateTime perl-Sys-Syslog perl-LWP-Protocol-https perl-Digest-SHA.x86_64 |
For EC2, it’s Ubuntu
1 2 3 4 | sudo apt-get update sudo apt-get install unzip sudo apt-get install libwww-perl libdatetime-perl |
If the OS you are using for EC2 is not the above 2 case, we can monitor the installation command for other cases here.
II. CloudWatch Monitoring Scripts
Combine with the Perl modules above so that we can show you the statistics as well as send them in standard format to CloudWatch.
First of all create a new directory or cd into the directory where you want to store the installation files. Then download CloudWatch Monitoring Scripts and extract it with the command:
1 2 3 4 5 | curl https://aws-cloudwatch.s3.amazonaws.com/downloads/CloudWatchMonitoringScripts-1.2.2.zip -O unzip CloudWatchMonitoringScripts-1.2.2.zip && rm CloudWatchMonitoringScripts-1.2.2.zip && cd aws-scripts-mon |

In the aws-scripts-mon folder just extracted, we will see there are 6 files as shown above, the meanings and functions of these files are:
- CloudWatchClient.pm – Combined with Perl modules to simplify calling Amazon CloudWatch from other scripts.
- mon-put-instance-data.pl – Collect system data on Amazon EC2 version (memory, swap, disk space usage) and send them to Amazon CloudWatch.
- mon-get-instance-stats.pl – Query Amazon CloudWatch and display the most recent usage statistics for the EC2 version on which this script is executed.
- awscreds.template – The sample file for AWS authentication information stores your access key ID and secret access key.
- LICENSE.txt – Text file containing Apache 2.0 license.
- NOTICE.txt – Copyright information.
4. Use
We run the following command to check the hard disk resource parameters immediately:
1 2 | ./mon-put-instance-data.pl --disk-space-util --disk-space-used --disk-space-avail --disk-path=/data --verify --verbose |
In which the options:
- –disk-space-util: Used hard disk space (%)
- –disk-space-used: Used hard disk space (GB)
- –disk-space-avail: Available hard disk space (GB)
- –disk-path = / data: Path to the directory you want to track the size.
Result:
1 2 3 4 5 6 7 8 9 10 11 | DiskSpaceUtilization [/data]: 13.6786702466 (Percent) DiskSpaceUsed [/data]: 13.4469451904297 (Gigabytes) DiskSpaceAvailable [/data]: 79.8433685302734 (Gigabytes) Using AWS credentials file <./awscreds.conf> No credential methods are specified. Trying default IAM role. Using IAM role <xxx-xxx> Endpoint: https://monitoring.ap-northeast-1.amazonaws.com Payload: {"MetricData":[{"MetricName":"DiskSpaceUtilization","Timestamp":1587267694,"Unit":"Percent","Dimensions":[{"Value":"/dev/nvme1n1","Name":"Filesystem"},{"Name":"InstanceId","Value":"i-0ea0f5923a6305ab3"},{"Name":"MountPath","Value":"/data"}],"Value":13.6786702466},{"Value":13.4469451904297,"Dimensions":[{"Value":"/dev/nvme1n1","Name":"Filesystem"},{"Value":"i-0ea0f5923a6305ab3","Name":"InstanceId"},{"Name":"MountPath","Value":"/data"}],"Timestamp":1587267694,"MetricName":"DiskSpaceUsed","Unit":"Gigabytes"},{"Unit":"Gigabytes","MetricName":"DiskSpaceAvailable","Timestamp":1587267694,"Value":79.8433685302734,"Dimensions":[{"Value":"/dev/nvme1n1","Name":"Filesystem"},{"Name":"InstanceId","Value":"i-0ea0f5923a6305ab3"},{"Name":"MountPath","Value":"/data"}]}],"Namespace":"System/Linux","__type":"com.amazonaws.cloudwatch.v2010_08_01#PutMetricDataInput"} Verification completed successfully. No actual metrics sent to CloudWatch. |
We can see the hard disk space used is nearly 13.7% ~ 13.4GB, the remaining capacity is 79.8GB. The above statement only shows us at that time and does not send that information to CloudWatch.
In addition, we can use many other options to be able to monitor other system information such as RAM:
| Name | Option |
|---|---|
| –mem-util | Collects and sends the MemoryUtilization metrics in percentages. This metric counts memory allocated by applications and the operating system as used, and also includes cache and buffer memory as used if you specify the –mem-used-incl-cache-buff option. |
| –mem-used | Collects and sends the MemoryUsed metrics, reported in megabytes. This metric counts memory allocated by applications and the operating system as used, and also includes cache and buffer memory as used if you specify the –mem-used-incl-cache-buff option. |
| –mem-used-incl-cache-buff | If you include this option, memory currently used for cache and buffers is counted as “used” when the metrics are reported for –mem-util, –mem-used, and –mem-avail. |
| –mem-avail | Collects and sends the MemoryAvailable metrics, reported in megabytes. This metric counts memory allocated by applications and the operating system as used, and also includes cache and buffer memory as used if you specify the –mem-used-incl-cache-buff option. |
| –swap-util | Collects and sends SwapUtilization metrics, reported in percentages. |
| –swap-used | Collects and sends SwapUsed metrics, reported in megabytes. |
| –disk-path = PATH | Selects the disk on which to report. PATH can specify a mount point or any file located on a mount point for the filesystem that needs to be reported. For selecting multiple disks, specify a –disk-path = PATH for each one of them. To select a disk for the filesystems mounted on / and / home, use the following parameters: –disk-path = / –disk-path = / home |
| –disk-space-util | Collects and sends the DiskSpaceUtilization metric for the selected disks. The metric is reported in percentages. Note that the disk utilization metrics calculated by this script differ from the values calculated by the df -k -l command. If you find the values from df -k -l more useful, you can change the calculations in the script. |
| –disk-space-used | Collects and sends the DiskSpaceUsed metric for the selected disks. The metric is reported by default in gigabytes. Due to reserved disk space in Linux operating systems, disk space used and disk space available might not accurately add up to the amount of total disk space. |
| –disk-space-avail | Collects and sends the DiskSpaceAvailable metric for the selected disks. The metric is reported in gigabytes. Due to reserved disk space in the Linux operating systems, disk space used and disk space available might not accurately add up to the amount of total disk space. |
| –memory-units = UNITS | Specifies units in which to report memory usage. If not specified, memory is reported in megabytes. UNITS may be one of the following: bytes, kilobytes, megabytes, gigabytes. |
| –disk-space-units = UNITS | Specifies units in which to report disk space usage. If not specified, disk space is reported in gigabytes. UNITS may be one of the following: bytes, kilobytes, megabytes, gigabytes. |
| –aws-credential- file = PATH | Provides the location of the file containing AWS credentials. This parameter cannot be used with the –aws-access-key-id and –aws-secret-key parameters. |
| –aws-access-key-id = VALUE | Specifies the AWS access key ID to use to identify the caller. Must be used together with the –aws-secret-key option. Do not use this option with the –aws-credential-file parameter. |
| –aws-secret-key = VALUE | Specifies the AWS secret access key to use to sign the request to CloudWatch. Must be used together with the –aws-access-key-id option. Do not use this option with –aws-credential-file parameter. |
| –aws-iam-role = VALUE | Specifies the IAM role used to provide AWS credentials. The value = VALUE is required. If no credentials are specified, the default IAM role associated with the EC2 instance is applied. Only one IAM role can be used. If no IAM roles are found, or if more than one IAM role is found, the script will return an error. Do not use this option with the –aws-credential-file, –aws-access-key-id, or –aws-secret-key parameters. |
| –aggregated [= only] | Adds aggregated metrics for instance type, AMI ID, and overall for the Region. The value = only is optional; if specified, the script reports only aggregated metrics. |
| –auto-scaling [= only] | Adds aggregated metrics for the Auto Scaling group. The value = only is optional; if specified, the script reports only Auto Scaling metrics. The IAM policy associated with the IAM account or role using the scripts need to have permissions to call the EC2 action DescribeTags. |
| –verify | Performs a test run of the script that collects the metrics, prepares a complete HTTP request, but does not actually call CloudWatch to report the data. This option also checks that credentials are provided. When run in verbose mode, this option outputs the metrics that will be sent to CloudWatch. |
| –from-cron | Use this option when calling the script from cron. When this option is used, all diagnostic output is suppressed, but error messages are sent to the local system log of the user account. |
| –verbose | Displays detailed information about what the script is doing. |
| –helpx | Displays usage information. |
| –version | Displays the version number of the script. |
In the next article, I will continue to instruct how to configure to send that system information to CloudWatch and set up Alarm to alert when those parameters meet a certain condition. Thanks for everyone who saw my article.
Reference: https://docs.aws.amazon.com/AWSEC2/latest/UserGuide/mon-scripts.html