Hi everybody! Actually I also want to write this article quite a long time since the beginning of ML, DL I’ve struggled with Jupyter-Notebook forever, the code on Jupyter is quite intuitive, but for beginners it is quite be surprised with the shortcuts in Jupyter such as how can run this line or that line, …. So I want to write this article with the purpose of sharing for beginners to get acquainted with the code on Jupyter. Hope it will be helpful .
1. Shortcuts in Jupyter
First to make working with jupyter notebook easier we need to know a few basic shortcuts. First, press the H key to show all the pre-installed shortcuts on the Jupyter notebook. However, if you want to edit the shortcut as you like, you can click on the edit shortcut.
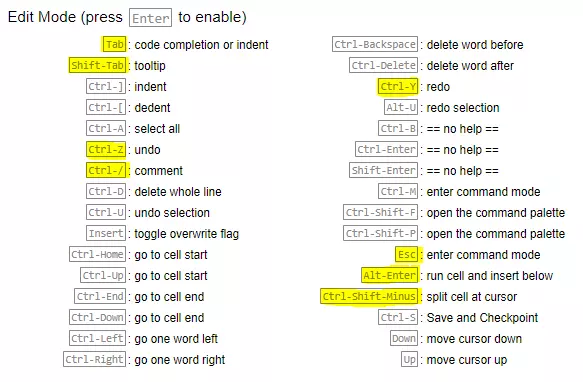
Figure 1a. Shortcuts in Jupyter
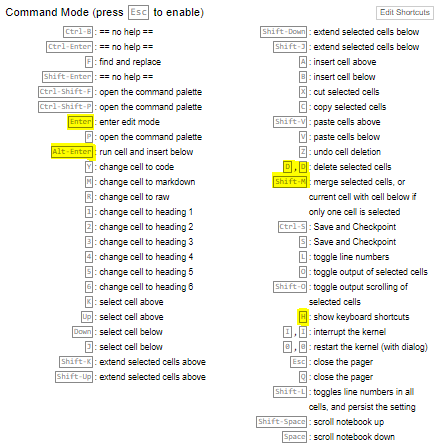
Figure 1b. Shortcuts in Jupyter
After pressing the H key, you will see the shortcuts as shown in Figure 1a and Figure 1b.
2. Display multiple outputs
A common problem is that the Jupyter notebook only shows one final output as the example below.
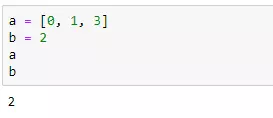
Figure 2a: shows only one output
However, it is quite inconvenient if you want to show a and b at the same time, you must use the print command or run each command line with variables a and b. Add the following command line.
1 2 3 | from IPython.core.interactiveshell import InteractiveShell InteractiveShell.ast_node_interactivity = "all" |
We will get the result as shown in Figure 2b below.
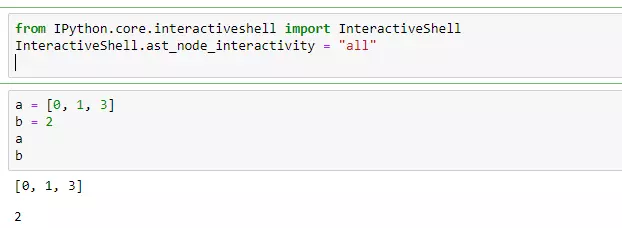
Figure 2b: show multiple output
3. Command shell can be executed directly inside jupyter notebook
You just added ! on before starting the command.
1 2 | !pip install pandas |
4. Calculate cell execution time
Use %%time to calculate the execution time of a cell as shown in Figure 3 below
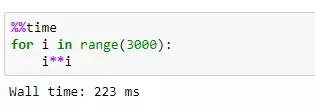
Figure 3: How to calculate cell execution time?
5. Show method documentation
When you don’t remember what function a function needs, you should do: shift + tab to review its doc.
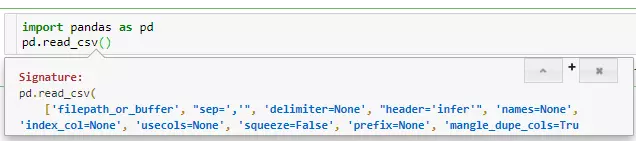
Figure 4a: View doc of a function by shift + tab
Or you can use the ? To see the doc of that function as shown in Figure 4b below:
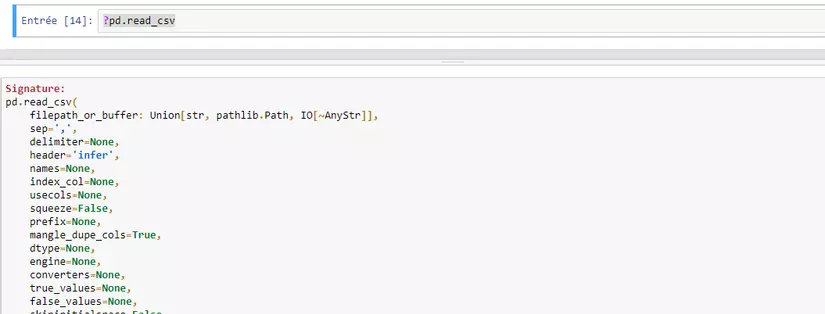
Figure 4b: using the ?
6. Expand the number of rows and cols when displaying the table
There is a problem I often encounter is that pandas sets rows and cols limits when displaying tables, but I can set it up according to my own will as follows:
1 2 3 4 | import pandas as pd pd.set_option('display.max_rows', 500) pd.set_option('display.max_columns', 500) |
You can change 500 or 1000 or more
7. Hide text when using matplotlib
When you use matplotlib to show a chart, there is usually a line above as shown in Figure 5a below:
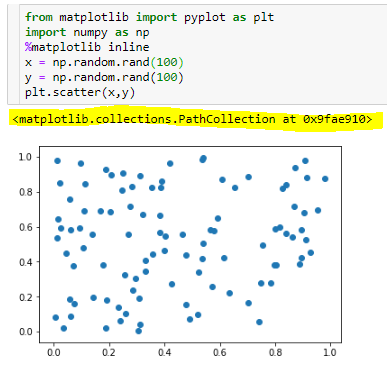
Figure 5a: Text when using matplotlib
However, if you do not like the text, you can hide it as shown in Figure 5b:
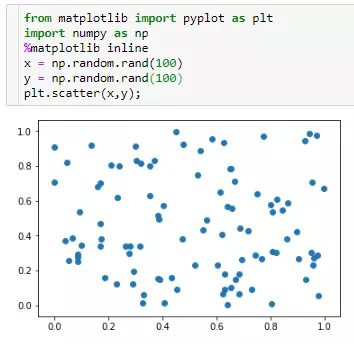
Figure 5b: hiding the text
6. Use magic command
We often use the command: %mathplotlib inline as a Jupyter Notebook statement to draw graphs inside the Jupyter Notebook cell. When using the magic command, the operation on the kernel of jupyter notebook will become simpler.
The magic command in jupyter notebook
1 2 3 4 5 6 7 8 9 10 11 | %pwd #print thư mục đang làm việc hiện tại %cd #thay đổi thư mục đang làm việc hiện tại %ls #hiển thị ra các file có trong thư mục %load [insert Python filename here] #load code vào trong Jupyter notebook %who #use %liệt kê tất cả các biến |
Conclude
Thank you everyone for reading my article. We hope to receive suggestions from everyone.
Reference
https://www.dataquest.io/blog/jupyter-notebook-tips-tricks-shortcuts/