Getting Start
What is Zipkin? Zipkin is a distributed tracing system. And what is tracing? Tracing is a technique to record information about a request like execution path, latency, what is the error so on and so forth. What this gives you is the ability to troubleshoot performance problem like where is the bottleneck, application health where is the error come from, what is the cause, which give you overview of your application as a whole and show you interaction between each services from the start to the end of each request. The techinique can apply to any software architecture, but is extremely essential to a distributed system.
There are many libraries out there that can help you add this to your system, but what we will looking at in this article is the one called Zipkin. Before we get started let me clarify this first. Zipkin is not a software that we can just run and expect to magically work out of the box. It is a tool and library that we, developer, must add into our application code that we want to trace.
Architecture
There are 4 major components that Zipkin provided
- Collector
- Query Service
- Storage
- Web UI
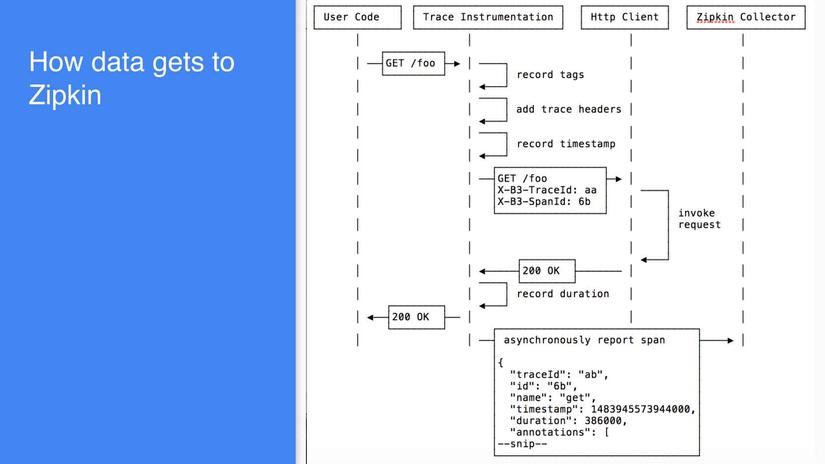
In an application lives tracers which record data about operations that took place. They are usually work along side with our services and is transparent to the user. Their main objective is to collect data from our service by adding an identifier, which is called Trace ID, along with custom metadata which we want to track. This data that is being collected is called a Span. Completed spans are reported to Zipkin asynchronously by a Reporter. Reporter send trace data using one of serveral transports.
Below is a diagram to illustrate how data get to zipkin
Collector
This is basically a service that just sit there and receive data from reporter and save it persisted storage, which will be later consume by a query service. Zipkin has three primary transports built-in
- HTTP
- Kafka
- Scribe
Although there are many others available as third party extensions.
Query Service
Trance data, which is stored and indexed in storage, are extracted by query daemon which provides a simple JSON API for finding and retrieving. The primary consumer of this API is the Web UI, but can be a custom build that tailored to fit a specific needed.
Storage
Zipkin natively support Cassandra, MySQL and Elasticsearhc as backend storage engine out of the box, but as always others are available as third party extensions.
Web UI
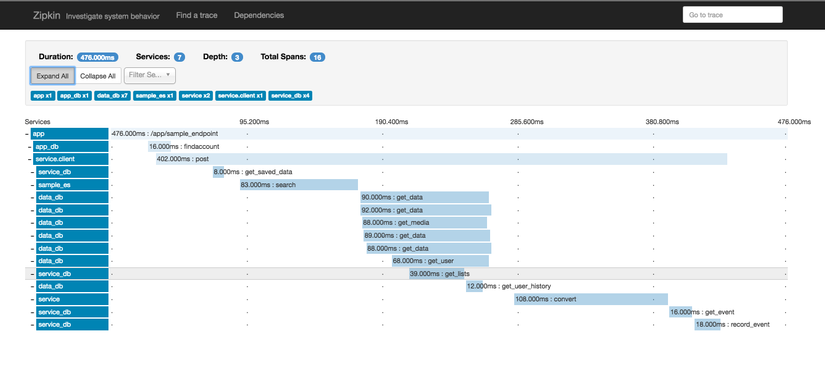
A web client that has a nice interface for viewing traces. You can query data based on service name, time, annotations or tag.
This is what the dashboard looks like. You can see duration of each service called and their relation.
Setting Up
Docker
The quickest way to get zipkin up and running is to use pre-build docker image. You can get it with the following command. This will pull docker image, spin it up in the background and expose it on port 9411
1 2 3 | $ docker pull openzipkin/zipkin $ docker run -d -p 9411:9411 openzipkin/zipkin |
The default storage engine come with core library is store In-Memory, to change it to elasticsearch you can spin up elasticsearch container and set environment variable like in docker-compose file below.
1 2 3 4 5 6 7 8 9 10 11 12 13 14 15 | <span class="token key atrule">version</span><span class="token punctuation">:</span> <span class="token string">"3"</span> <span class="token key atrule">services</span><span class="token punctuation">:</span> <span class="token key atrule">elasticsearch</span><span class="token punctuation">:</span> <span class="token key atrule">image</span><span class="token punctuation">:</span> openzipkin/zipkin<span class="token punctuation">-</span>elasticsearch <span class="token key atrule">zipkin</span><span class="token punctuation">:</span> <span class="token key atrule">image</span><span class="token punctuation">:</span> openzipkin/zipkin <span class="token key atrule">environment</span><span class="token punctuation">:</span> <span class="token punctuation">-</span> STORAGE_TYPE=elasticsearch <span class="token punctuation">-</span> ES_HOSTS=elasticsearch<span class="token punctuation">:</span><span class="token number">9200</span> <span class="token key atrule">ports</span><span class="token punctuation">:</span> <span class="token punctuation">-</span> 9411<span class="token punctuation">:</span><span class="token number">9411</span> <span class="token key atrule">depends_on</span><span class="token punctuation">:</span> <span class="token punctuation">-</span> elasticsearch6 |
For more storage configuration checkout documentation on their github page
What’s Next?
This conclude the basic understanding and how to get zipkin up and running. In the next article we will look at how to integrate it with Go application.