Today, we are deploying all systems to the Cloud platform, we are gradually converting applications that use centralized architecture with UI, database packaged in one block (monolith) into applications. Distribute, split each component independently in Microservice architecture. Telemetry is an important component in systems that use Microservice architecture.
Telemetry is an automated diagnostic and data transfer from remote sources , in DevOps , telemetry is like a doctor for the system, it diagnoses and issues notifications to us. Telemetry is responsible for:
- Monitoring
- Alerts and data statistics
- Keep track of distributed systems
- Centralized log
Monitoring
Telemetry ‘s first task is to know the information about the system when it is operating. Monitoring microservices architecture is not easy, it includes many middleware servers , container cache , many database cluster do not share the same port. We have used plugins like Nagios and Sensu to solve this problem. However, today you have to change from the development process so that services can attach Telemetry to the application architecture.
Alerts and data statistics
Alerts are often used in the form of Data model called Time Series , which often use OpenTSDB or Apache Cassandra as storage. These databases are called InfluxDB, they are very easy to use, but they also make it difficult for us to expand.
Statistics data is not just a simple graph, the statistics will show through dozens of graphs, one of the best options for us is Grafana . They will display all the information gathered in a dashboard window, from which you can use to find issues, evaluate system performance and potential problems. In addition to Grafana, a very popular way is to use Advanced Math in predicting and displaying information from Telemetry , Atlas being used at Netflix to apply this solution. Atlas is built from Scala , Akka and Spray .
Atlas simplifies requirements capture, management, and tracking so teams can respond with agility to shifting business priorities and customer expectations. This software delivery and testing tool removes communication bottlenecks between business and development teams to speed up the delivery process in Agile development.
Keep track of distributed systems
Tracking distributed systems is to look at all of the immutable event occur within the system, through monitoring streams. The solution to this problem is often a concept called retention . Often it will store all events occur in the system, sort and compare them with each other. In microservice architecture, traditional monolithic applications are broken down into components that can be independently deployed. An application gradually becomes a group of microservice, when you have hundreds, thousands of small microservice operating together, it will not be easy for you to know which services are calling each other, which one request is going from which service to service.
To solve this problem, a technique introduced is Distributed Tracing . Distributed Tracing is a way to profile and monitor applications, especially those that use microservices architecture. It helps determine exactly which service when it fails and what is affecting the performance of the application. Riemann is built around the idea of Stream.
Riemann is an event stream processor.
Every time something important happens in your system, submit an event to Riemann. Just handled an HTTP request? Send an event with the time it took. Caught an exception? Send an event with the stacktrace. Small daemons can watch your servers and send events about disk capacity, CPU use, and memory consumption. Every second. It’s like top for hundreds of machines at once. Riemann filters, combination, and acts on flows of events to understand your systems.
Further reference: Reimann 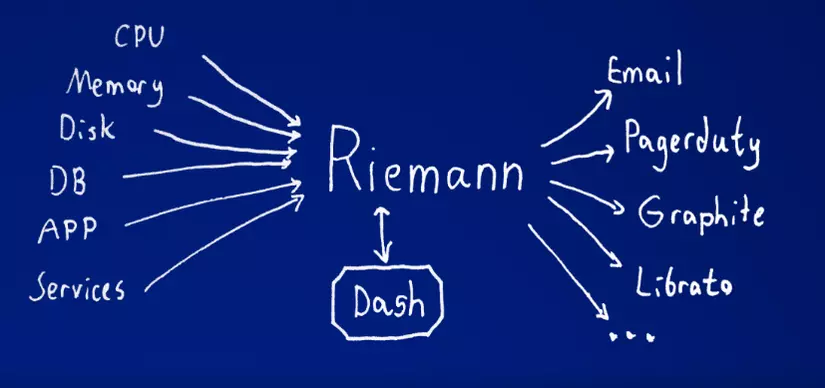
In addition, Jaeger Tracing is also a solution for tracking services in a Microservice system. . 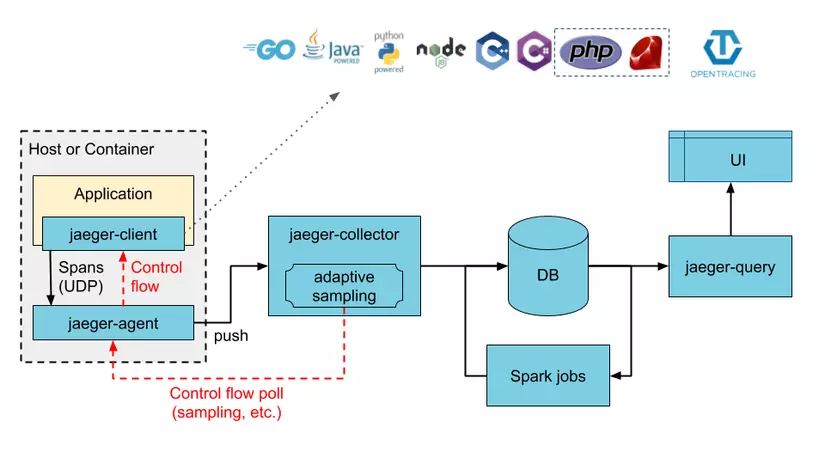
Centralized log
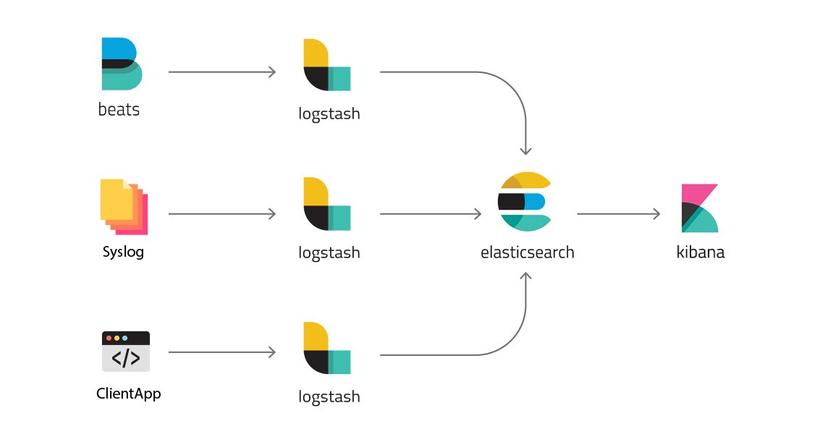
When you deploy applications that are packaged in Container such as Docker or Virtualization , you often have a lot of servers and those container require it to be stateless. You can no longer save logs in File Storage as before, instead they are centralized log storage solutions like ELK or Graylog. The ELK stack bao gồm Elasticsearch, Logstash and Kibana, where Logstash collects logs in your applications and stores them in Elasticsearch and Kibana will show them on a interface that is more friendly to you.