
Monitoring is a topic that is no longer strange and still very hot to us :v. Especially when working in monitoring , most of you will probably remember the divine duo Prometheus and Grafana .
Today, I will demo setup this monitor using docker and add logging using Loki (also a product of GrafanaLabs). Loki: like Prometheus, but for logs. Loki ‘s intro :v reads it and gets to work :v :v :v
In this article, I will install the following components:
- Prometheus (metrics database):
http://<host-ip>:9090 - Prometheus-pushgateway (push acceptor for ephemeral and batch jobs):
http://<host-ip>:9091 - AlertManager (alerts management):
http://<host-ip>:9093 - Grafana (visualize metrics):
http://<host-ip>:3000 - Loki (likes prometheus, but for logs):
http://<host-ip>:3100 - Promtail (is the agent, responsible for gathering logs and sending them to Loki)
- NodeExporter (host metrics collector)
- cAdvisor (containers metrics collector)
- Caddy (reverse proxy and basic auth provider for prometheus and alertmanager)
My source code is here
For convenience in the article, I will call this demo domolo for you to follow easily (domolo: docker – monitor -log).
Ok!!! Come in
Setup
First, install docker on your computer. After that, you clone the source code to:
1 2 3 4 5 | <span class="token function">git</span> clone https://github.com/ductnn/domolo.git <span class="token builtin class-name">cd</span> domolo docker-compose up -d <span class="token comment"># À từ hẵng chạy ...</span> |
The structure of the domolo looks like this:
1 2 3 4 5 6 7 8 9 10 11 12 13 14 15 16 17 18 19 20 21 22 23 24 25 26 27 28 29 30 31 32 | <span class="token builtin class-name">.</span> ├── alertmanager │ └── config.yml ├── assets ├── caddy │ └── Caddyfile ├── fake-logs │ ├── Dockerfile │ ├── README │ └── entrypoint.sh ├── grafana │ └── provisioning │ ├── dashboards │ │ ├── dashboard.yml │ │ ├── docker_containers.json │ │ ├── docker_host.json │ │ ├── monitor_services.json │ │ ├── nginx_container.json │ │ └── node_exporter_full.json │ └── datasources │ └── datasource.yml ├── loki │ ├── loki-config.yaml │ └── promtail-config.yaml ├── prometheus │ ├── alert.rules │ └── prometheus.yml ├── config ├── docker-compose.agents.yml ├── docker-compose.with-flogs.yml ├── docker-compose.yml |
Grafana
In Grafana I will setup 2 main parts:
- Datasources
- Dashboards
First, you edit the config file to set up user vs password variables to your liking:
1 2 3 4 | GF_SECURITY_ADMIN_USER=admin GF_SECURITY_ADMIN_PASSWORD=changeme GF_USERS_ALLOW_SIGN_UP=false |
In the datasources section we will preconfigure prometheus and loki :
1 2 3 4 5 6 7 8 9 10 11 12 13 14 15 16 17 18 19 20 21 22 | <span class="token key atrule">apiVersion</span> <span class="token punctuation">:</span> <span class="token number">1</span> <span class="token key atrule">datasources</span> <span class="token punctuation">:</span> <span class="token punctuation">-</span> <span class="token key atrule">name</span> <span class="token punctuation">:</span> Prometheus <span class="token key atrule">type</span> <span class="token punctuation">:</span> prometheus <span class="token key atrule">access</span> <span class="token punctuation">:</span> proxy <span class="token key atrule">orgId</span> <span class="token punctuation">:</span> <span class="token number">1</span> <span class="token key atrule">url</span> <span class="token punctuation">:</span> http <span class="token punctuation">:</span> //prometheus <span class="token punctuation">:</span> <span class="token number">9090</span> <span class="token key atrule">basicAuth</span> <span class="token punctuation">:</span> <span class="token boolean important">false</span> <span class="token key atrule">isDefault</span> <span class="token punctuation">:</span> <span class="token boolean important">true</span> <span class="token key atrule">editable</span> <span class="token punctuation">:</span> <span class="token boolean important">true</span> <span class="token punctuation">-</span> <span class="token key atrule">name</span> <span class="token punctuation">:</span> Loki <span class="token key atrule">type</span> <span class="token punctuation">:</span> loki <span class="token key atrule">access</span> <span class="token punctuation">:</span> proxy <span class="token key atrule">jsonData</span> <span class="token punctuation">:</span> <span class="token key atrule">maxLines</span> <span class="token punctuation">:</span> <span class="token number">1000</span> <span class="token key atrule">basicAuth</span> <span class="token punctuation">:</span> <span class="token boolean important">false</span> <span class="token key atrule">url</span> <span class="token punctuation">:</span> http <span class="token punctuation">:</span> //loki <span class="token punctuation">:</span> <span class="token number">3100</span> <span class="token key atrule">isDefault</span> <span class="token punctuation">:</span> <span class="token boolean important">false</span> <span class="token key atrule">editable</span> <span class="token punctuation">:</span> <span class="token boolean important">true</span> |
This will help us not need to add these 2 guys after building the cluster. The dashboards of Grafana I will present below.
Prometheus + Node Exporter
Prometheus ( metrics database ): Responsible for getting metrics information from targets and saving them. The main configuration section of prometheus is here , the parameters myself use:
- global : Used to set up the periodic period of prometheus pull metrics, and the
external_labelsparameter to be able to getmetricsinformation from external systems about prometheus . - alerting : Connection information to Alert Manager.
- rule_files : This is the important part of warning handling. You can set rules depending on your needs, for example, high CPU or RAM load warnings. You can follow some sample rules here
- scrape_configs : Connect to targets to get
metric.
Direct monitoring of the prometheus system:
1 2 3 4 5 6 | <span class="token key atrule">scrape_configs</span> <span class="token punctuation">:</span> <span class="token punctuation">-</span> <span class="token key atrule">job_name</span> <span class="token punctuation">:</span> <span class="token string">'nodeexporter'</span> <span class="token key atrule">scrape_interval</span> <span class="token punctuation">:</span> 5s <span class="token key atrule">static_configs</span> <span class="token punctuation">:</span> <span class="token punctuation">-</span> <span class="token key atrule">targets</span> <span class="token punctuation">:</span> <span class="token punctuation">[</span> <span class="token string">'nodeexporter:9100'</span> <span class="token punctuation">]</span> |
Monitor other systems:
1 2 3 4 5 6 7 8 9 | <span class="token key atrule">external_labels</span> <span class="token punctuation">:</span> <span class="token key atrule">monitor</span> <span class="token punctuation">:</span> <span class="token string">'docker-host-alpha'</span> <span class="token key atrule">scrape_configs</span> <span class="token punctuation">:</span> <span class="token punctuation">-</span> <span class="token key atrule">job_name</span> <span class="token punctuation">:</span> <span class="token string">'ApiExporter'</span> <span class="token key atrule">scrape_interval</span> <span class="token punctuation">:</span> 5s <span class="token key atrule">static_configs</span> <span class="token punctuation">:</span> <span class="token punctuation">-</span> <span class="token key atrule">targets</span> <span class="token punctuation">:</span> <span class="token punctuation">[</span> <span class="token string">'<IP Server needed Monitor>:Port'</span> <span class="token punctuation">]</span> |
Node Exporter ( host metrics collector ): Responsible for collecting metrics from servers. Here, I will get metrics information at /proc , /sys :
1 2 3 4 5 | <span class="token key atrule">volumes</span> <span class="token punctuation">:</span> <span class="token punctuation">-</span> /proc <span class="token punctuation">:</span> /host/proc <span class="token punctuation">:</span> ro <span class="token punctuation">-</span> /sys <span class="token punctuation">:</span> /host/sys <span class="token punctuation">:</span> ro <span class="token punctuation">-</span> / <span class="token punctuation">:</span> /rootfs <span class="token punctuation">:</span> ro |
To setup node_exporter on the server, you need to monitor that you run the file docker-compose.agents.yml
1 2 | docker-compose -f docker-compose.agents.yml up -d |
In addition, in the docker-compose.agents.yml file, we will set up cAdvisor (same as node_exporter but different, cAdvisor gets the metrics of containers), and promtail I will show below.
Grafana Dashboards
In this part, you can create your own dashboard to suit the needs of your project, or you can go to Grafana Dashboards to find templates quickly (so beautiful, vl)
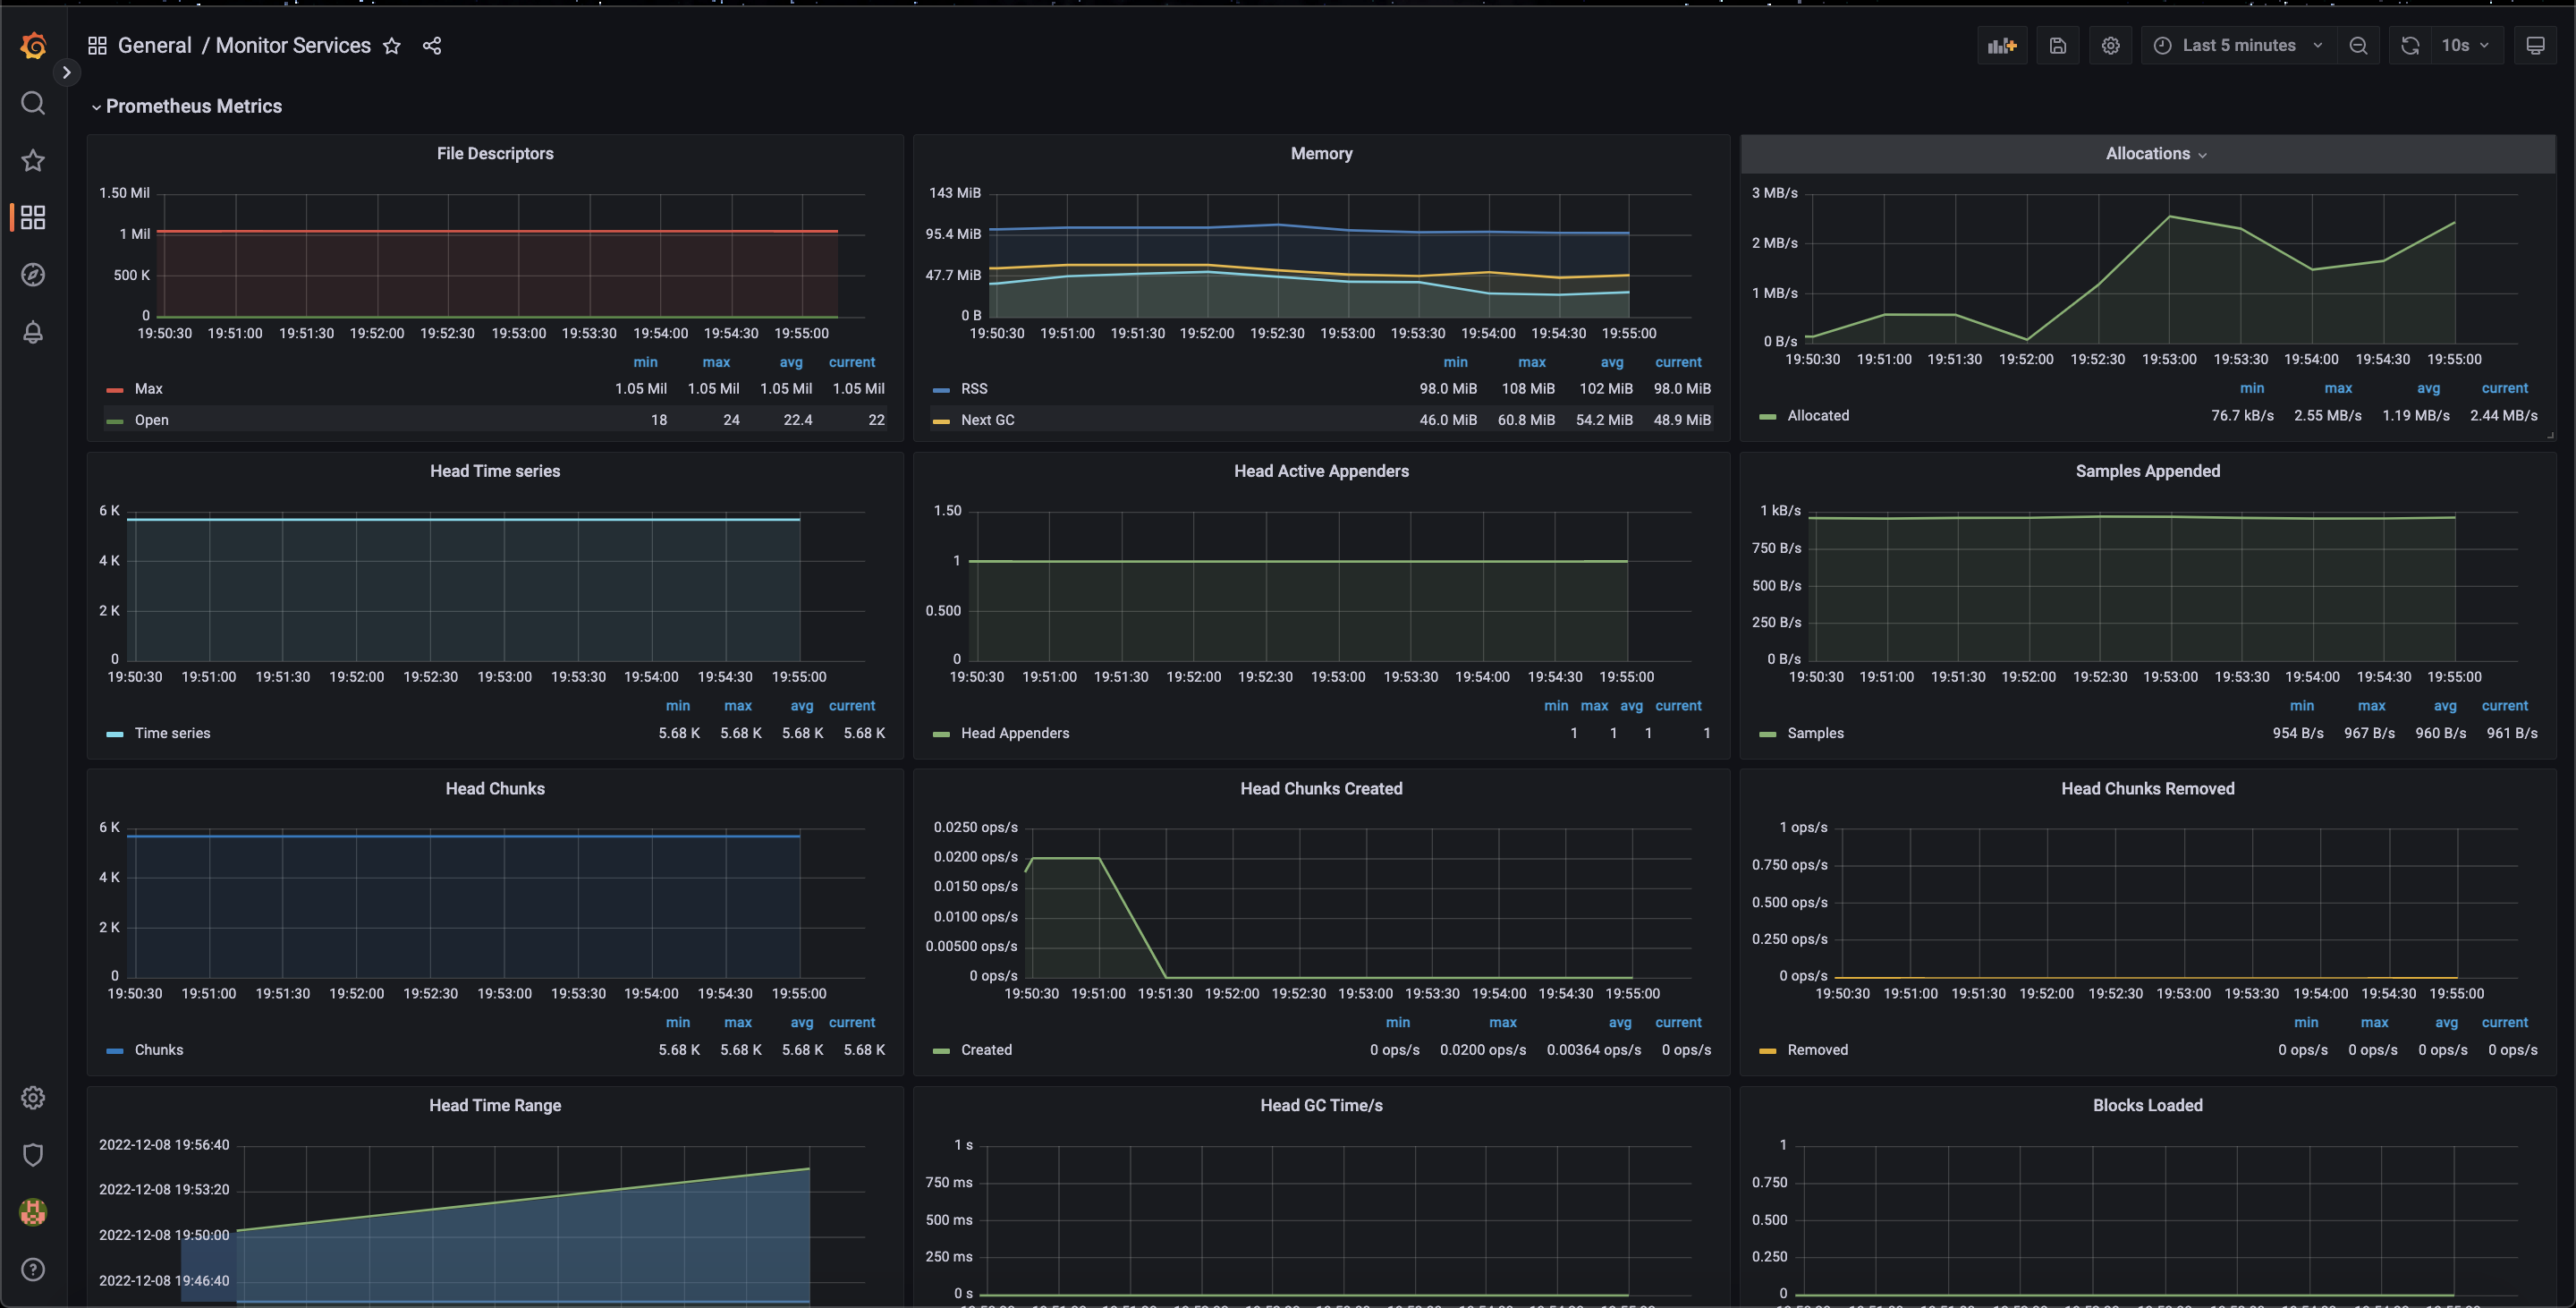
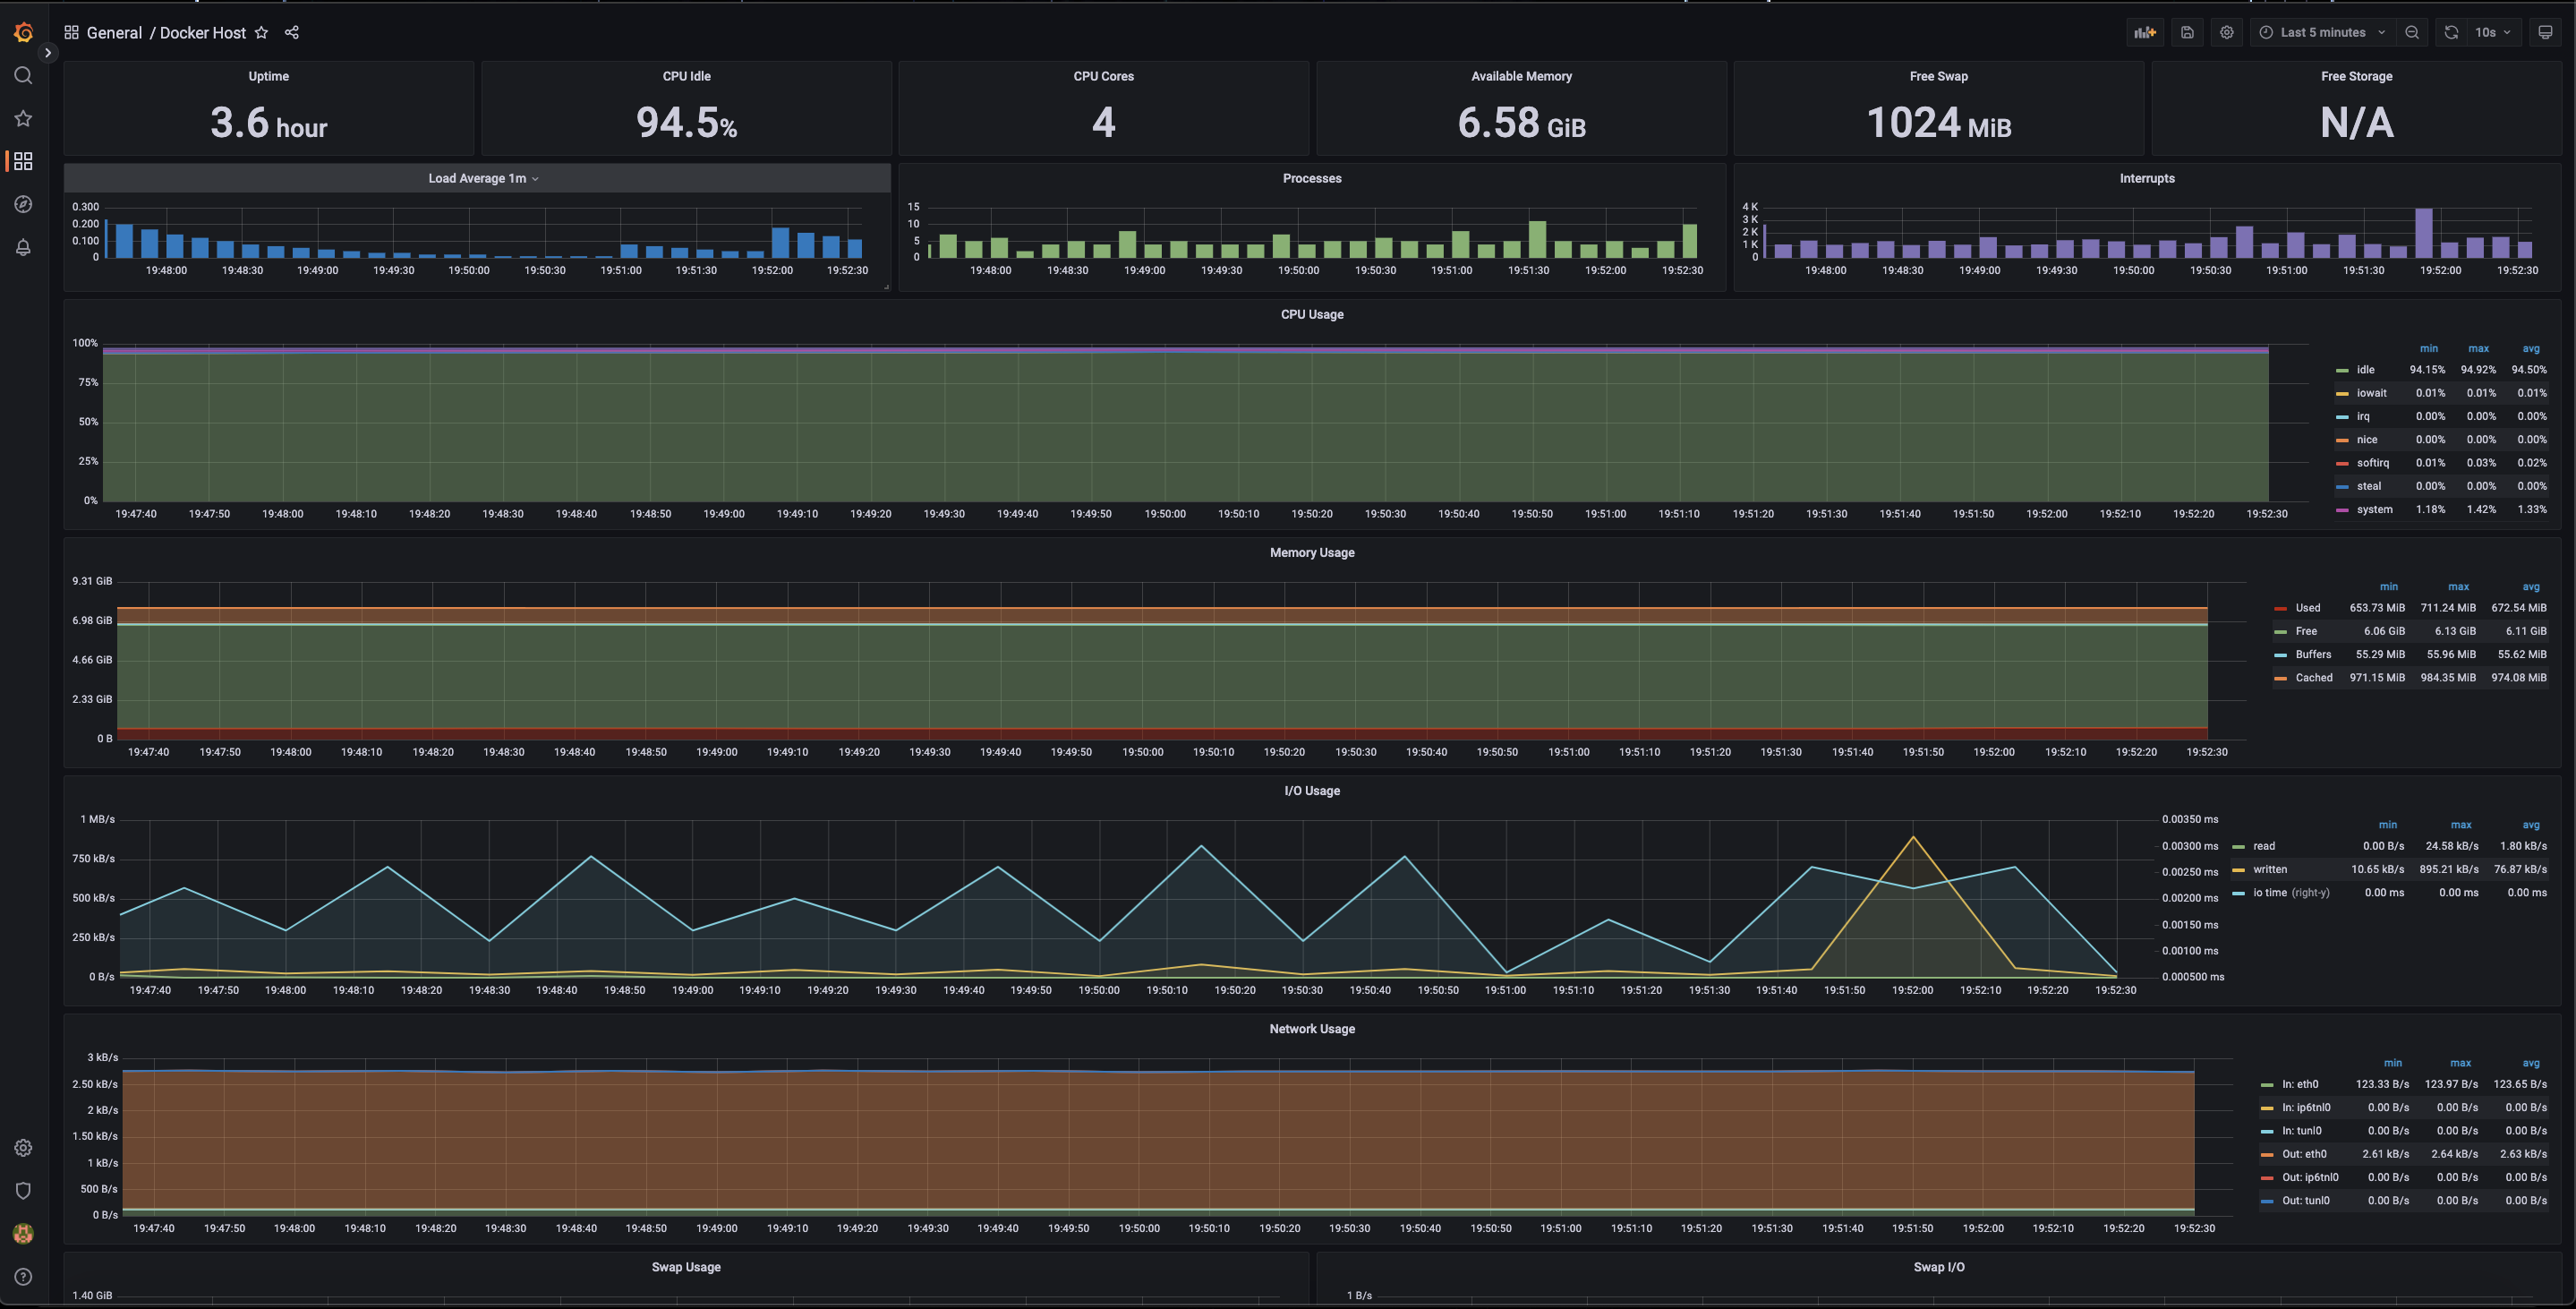
In this section, I used a few dashboards :
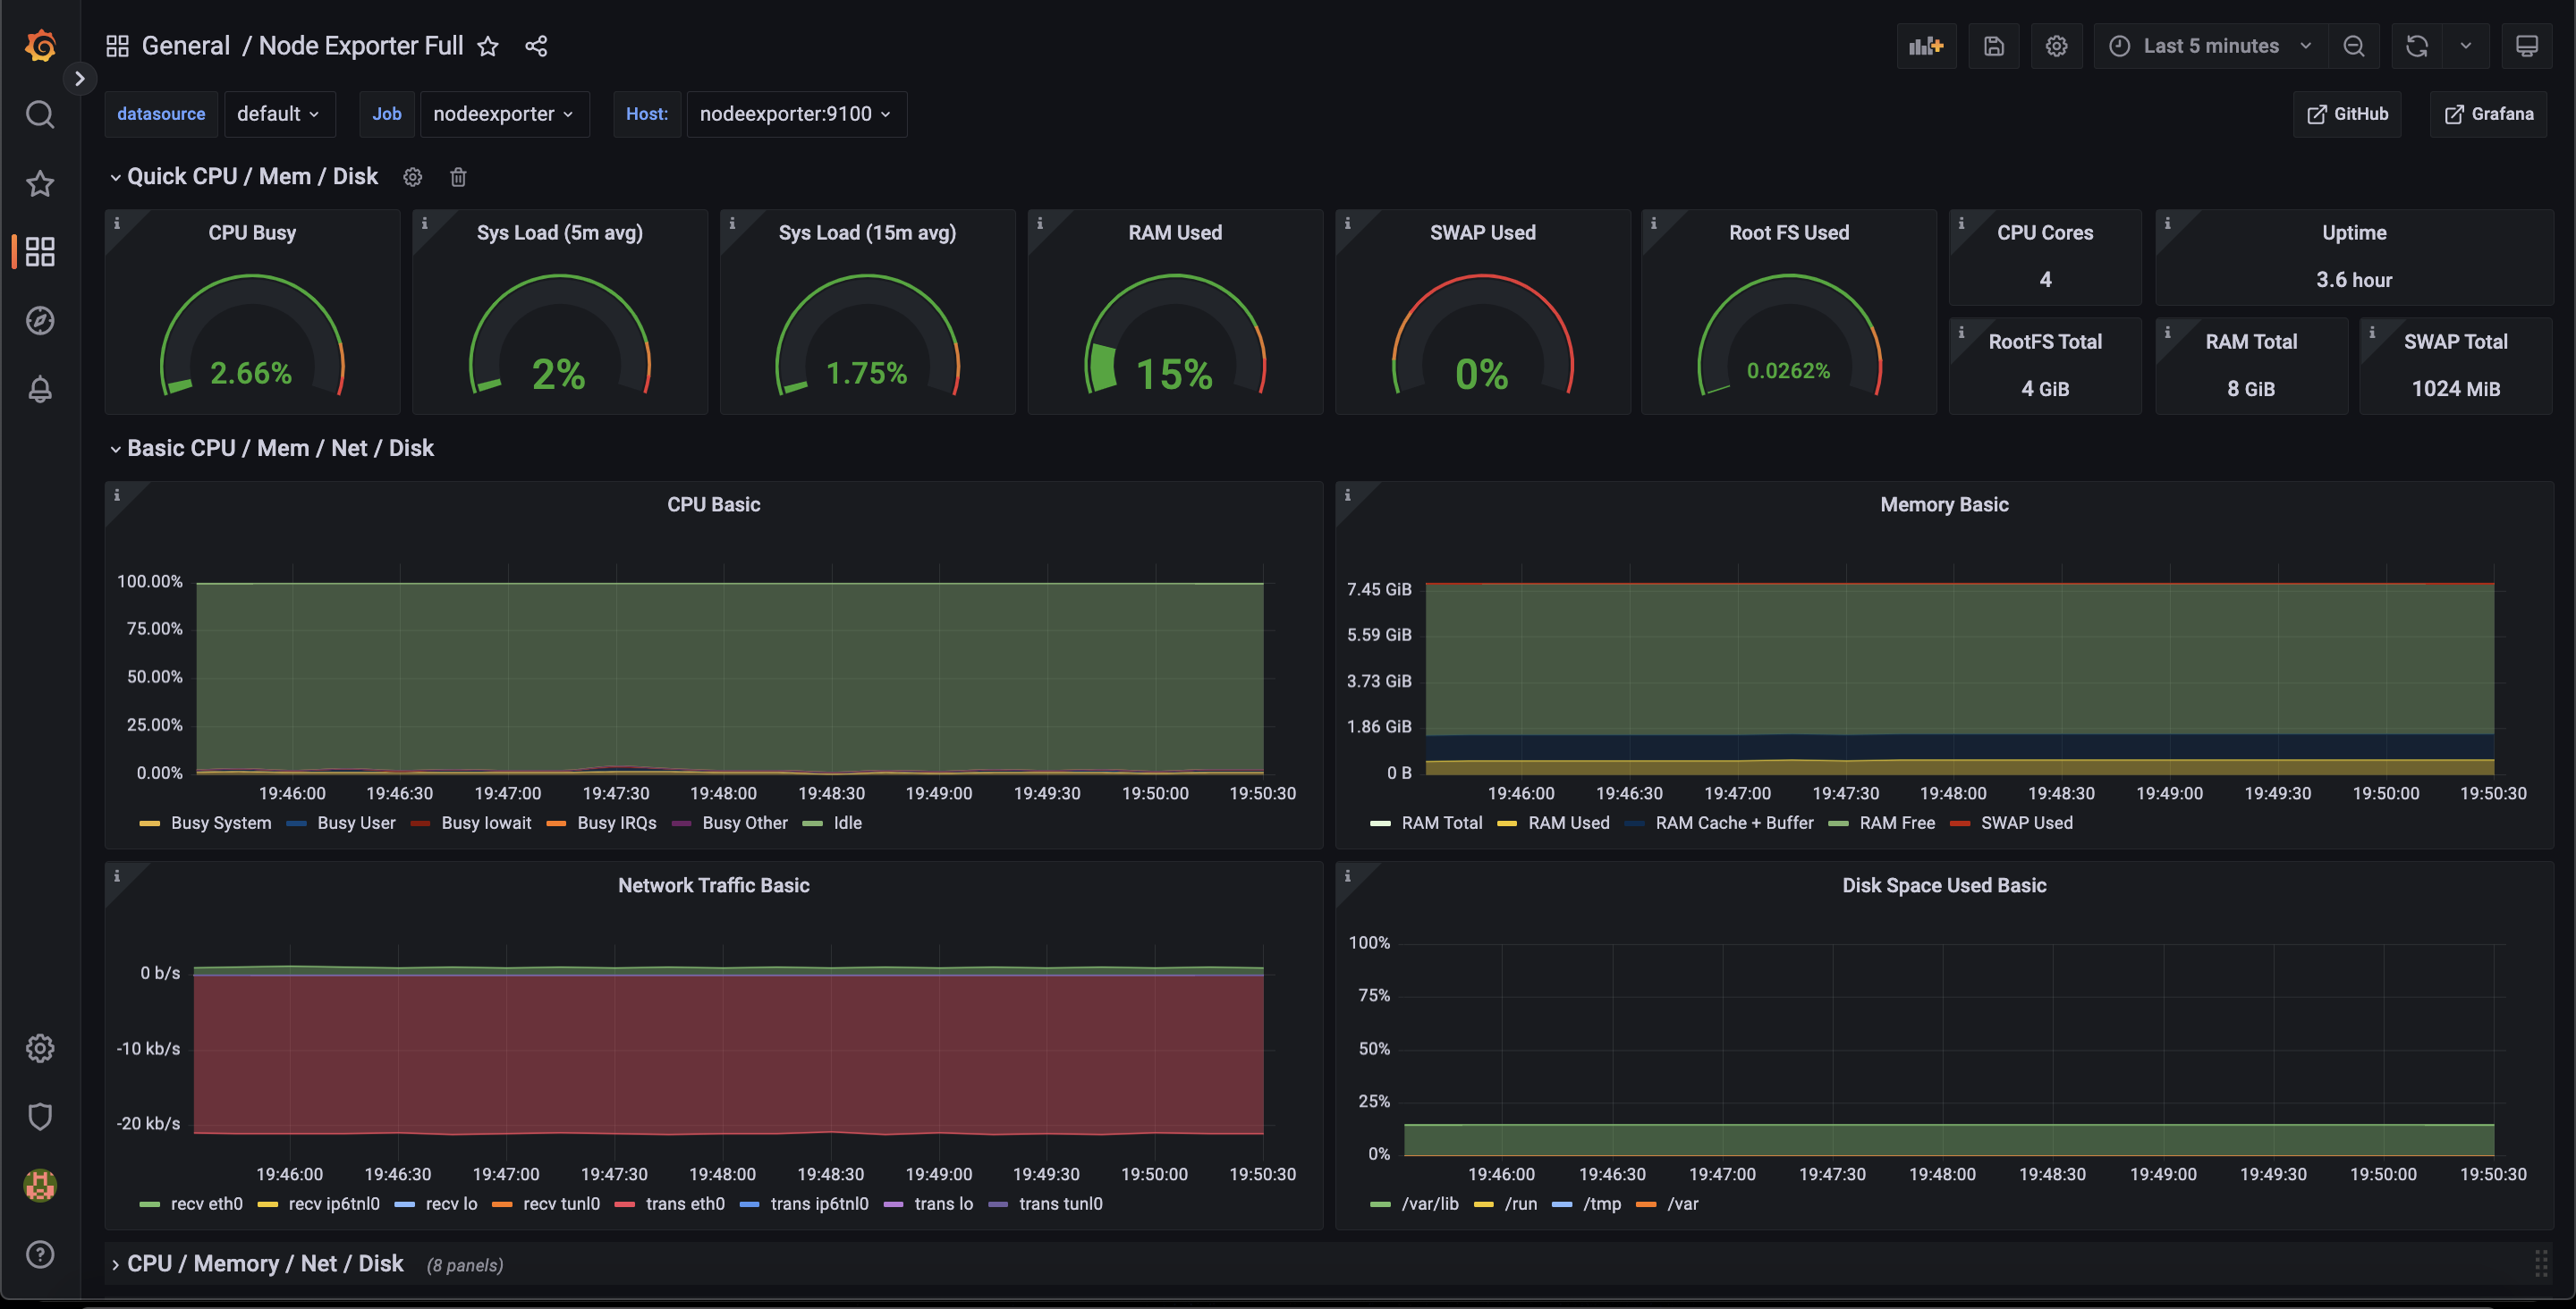
Monitor Services
Docker Host
Loki + Promtail
Loki is inspired by prometheus , a system for collecting, storing, and analyzing logs. We can easily query logs from Loki and limit the amount of logs received and time to process old logs. You can refer to my loki config file here . Or go directly to the github page to see :v
Promtail tool to get logs and send them to Loki server . In domolo I use promtail to collect logs of containers and the system:
1 2 3 4 | <span class="token key atrule">volumes</span> <span class="token punctuation">:</span> <span class="token punctuation">-</span> /var/run/docker.sock <span class="token punctuation">:</span> /var/run/docker.sock <span class="token punctuation">-</span> /var/log <span class="token punctuation">:</span> /var/log <span class="token punctuation">:</span> ro |
- Scape logs containers:
1 2 3 4 5 6 7 8 9 | <span class="token punctuation">-</span> <span class="token key atrule">job_name</span> <span class="token punctuation">:</span> container_logs <span class="token key atrule">docker_sd_configs</span> <span class="token punctuation">:</span> <span class="token punctuation">-</span> <span class="token key atrule">host</span> <span class="token punctuation">:</span> unix <span class="token punctuation">:</span> ///var/run/docker.sock <span class="token key atrule">refresh_interval</span> <span class="token punctuation">:</span> 5s <span class="token key atrule">relabel_configs</span> <span class="token punctuation">:</span> <span class="token punctuation">-</span> <span class="token key atrule">source_labels</span> <span class="token punctuation">:</span> <span class="token punctuation">[</span> <span class="token string">'__meta_docker_container_name'</span> <span class="token punctuation">]</span> <span class="token key atrule">regex</span> <span class="token punctuation">:</span> <span class="token string">'/(.*)'</span> <span class="token key atrule">target_label</span> <span class="token punctuation">:</span> <span class="token string">'container'</span> |
- Scrape logs systems:
1 2 3 4 5 6 7 8 | <span class="token punctuation">-</span> <span class="token key atrule">job_name</span> <span class="token punctuation">:</span> system <span class="token key atrule">static_configs</span> <span class="token punctuation">:</span> <span class="token punctuation">-</span> <span class="token key atrule">targets</span> <span class="token punctuation">:</span> <span class="token punctuation">-</span> localhost <span class="token key atrule">labels</span> <span class="token punctuation">:</span> <span class="token key atrule">job</span> <span class="token punctuation">:</span> varlogs <span class="token key atrule">__path__</span> <span class="token punctuation">:</span> /var/log/ <span class="token important">*log</span> |
Ok!!! So that’s the end of the theory part of Loki and promtail . Next, I’ll try to build it up and see how it looks.
Demo
First, I created a small tool to automatically generate logs. You guys can watch it here . This tool I wrote in bash script simply prints out some miscellaneous and colorful messages :v
1 2 3 4 5 6 7 8 9 10 11 12 13 14 15 | ➜ domolo git: <span class="token punctuation">(</span> master <span class="token punctuation">)</span> <span class="token builtin class-name">cd</span> fake-logs ➜ fake-logs git: <span class="token punctuation">(</span> master <span class="token punctuation">)</span> ✗ <span class="token function">chmod</span> +x entrypoint.sh ➜ fake-logs git: <span class="token punctuation">(</span> master <span class="token punctuation">)</span> ✗ ./entrypoint.sh <span class="token number">2022</span> -12-08T13:20:00Z ERROR An error is usually an exception that has been caught and not handled. <span class="token number">2022</span> -12-08T13:20:00Z DEBUG This is a debug log that shows a log that can be ignored. <span class="token number">2022</span> -12-08T13:20:01Z WARN A warning that should be ignored is usually at this level and should be actionable. <span class="token number">2022</span> -12-08T13:20:03Z ERROR An error is usually an exception that has been caught and not handled. <span class="token number">2022</span> -12-08T13:20:05Z ERROR An error is usually an exception that has been caught and not handled. <span class="token number">2022</span> -12-08T13:20:09Z INFO This is <span class="token function">less</span> important than debug log and is often used to provide context <span class="token keyword">in</span> the current task. <span class="token number">2022</span> -12-08T13:20:13Z ERROR An error is usually an exception that has been caught and not handled. <span class="token number">2022</span> -12-08T13:20:15Z DEBUG This is a debug log that shows a log that can be ignored. <span class="token number">2022</span> -12-08T13:20:16Z INFO This is <span class="token function">less</span> important than debug log and is often used to provide context <span class="token keyword">in</span> the current task. <span class="token number">2022</span> -12-08T13:20:17Z INFO This is <span class="token function">less</span> important than debug log and is often used to provide context <span class="token keyword">in</span> the current task. <span class="token punctuation">..</span> . |
After that, I close it into a Dockerfile and add it in the docker-compose file or you can use the docker-compose.with-flogs.yml file and then proceed to build …
1 2 | docker-compose -f docker-compose.with-flogs.yml up -d |
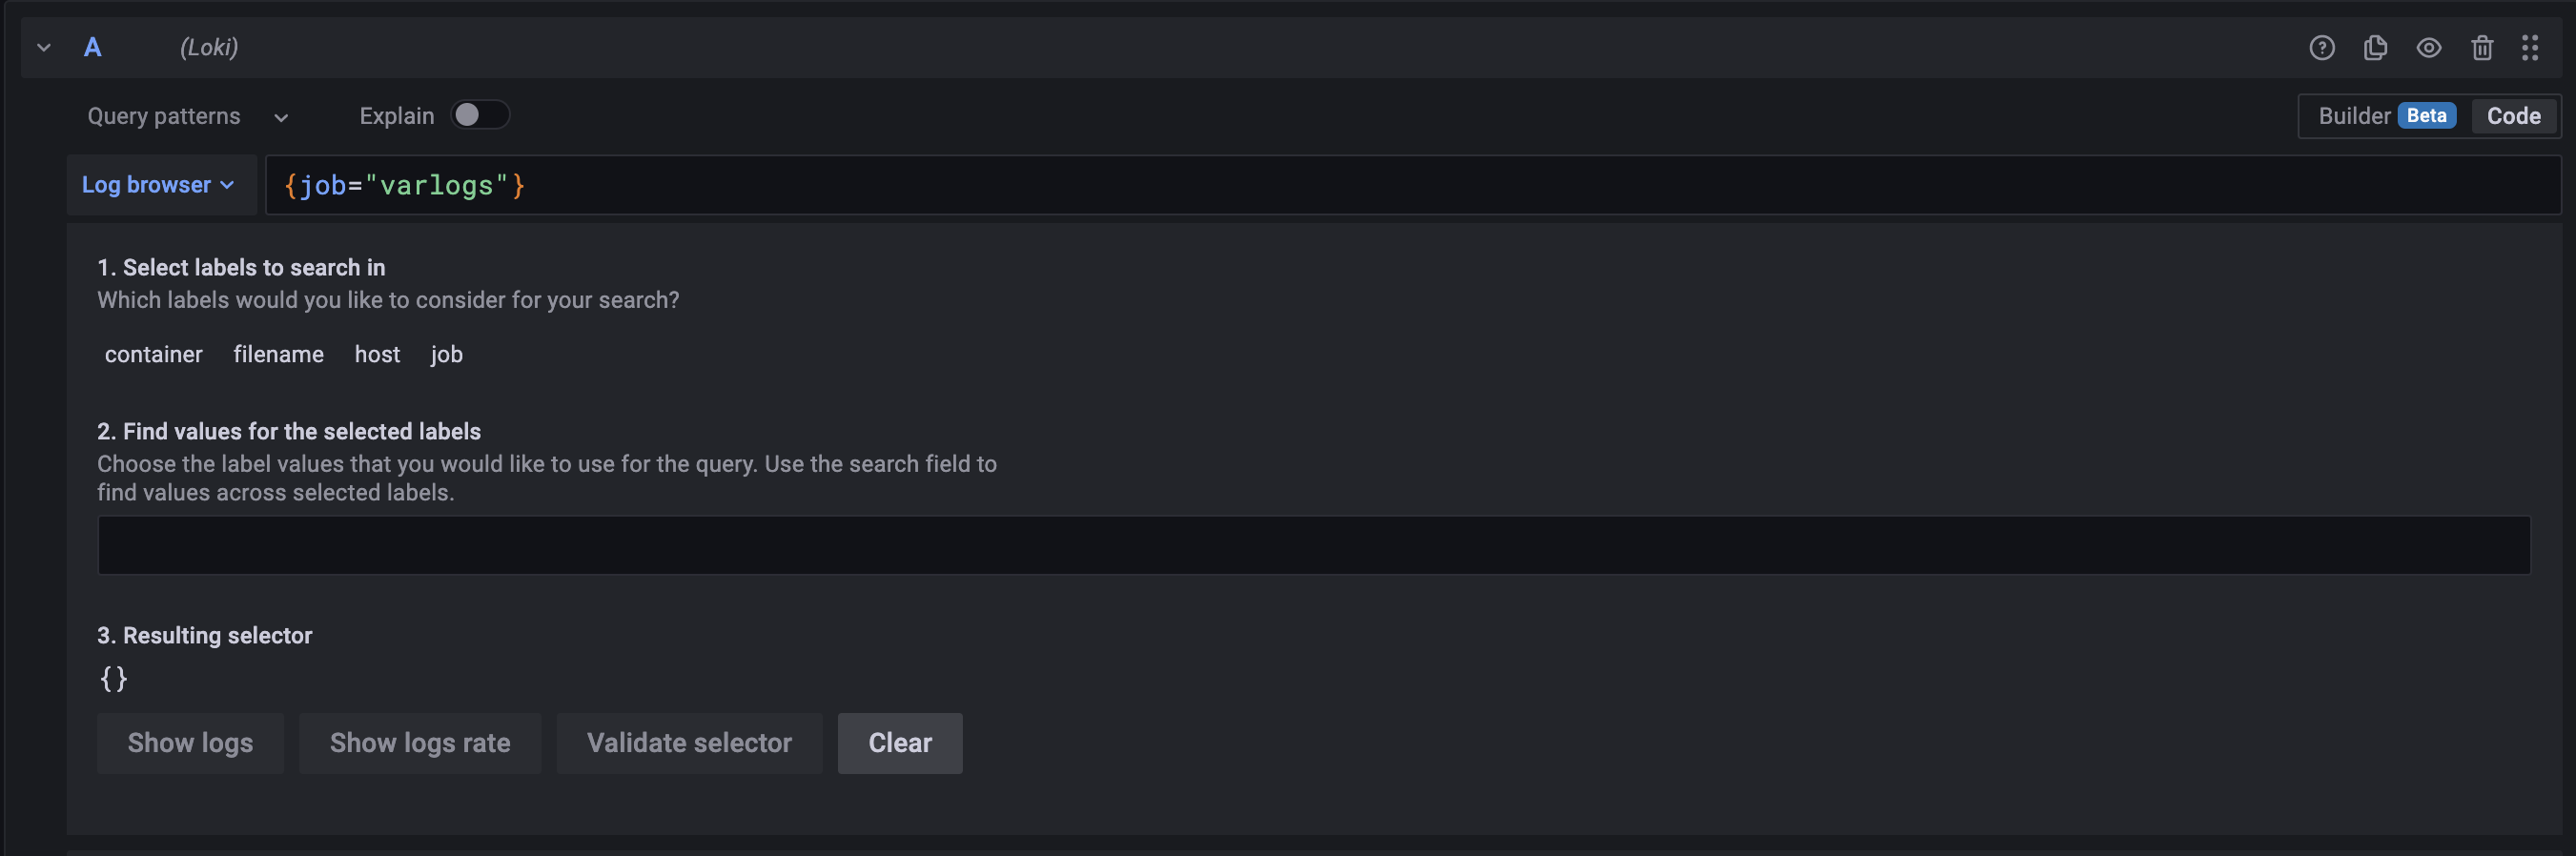
Done and then access grafana and select Explore :
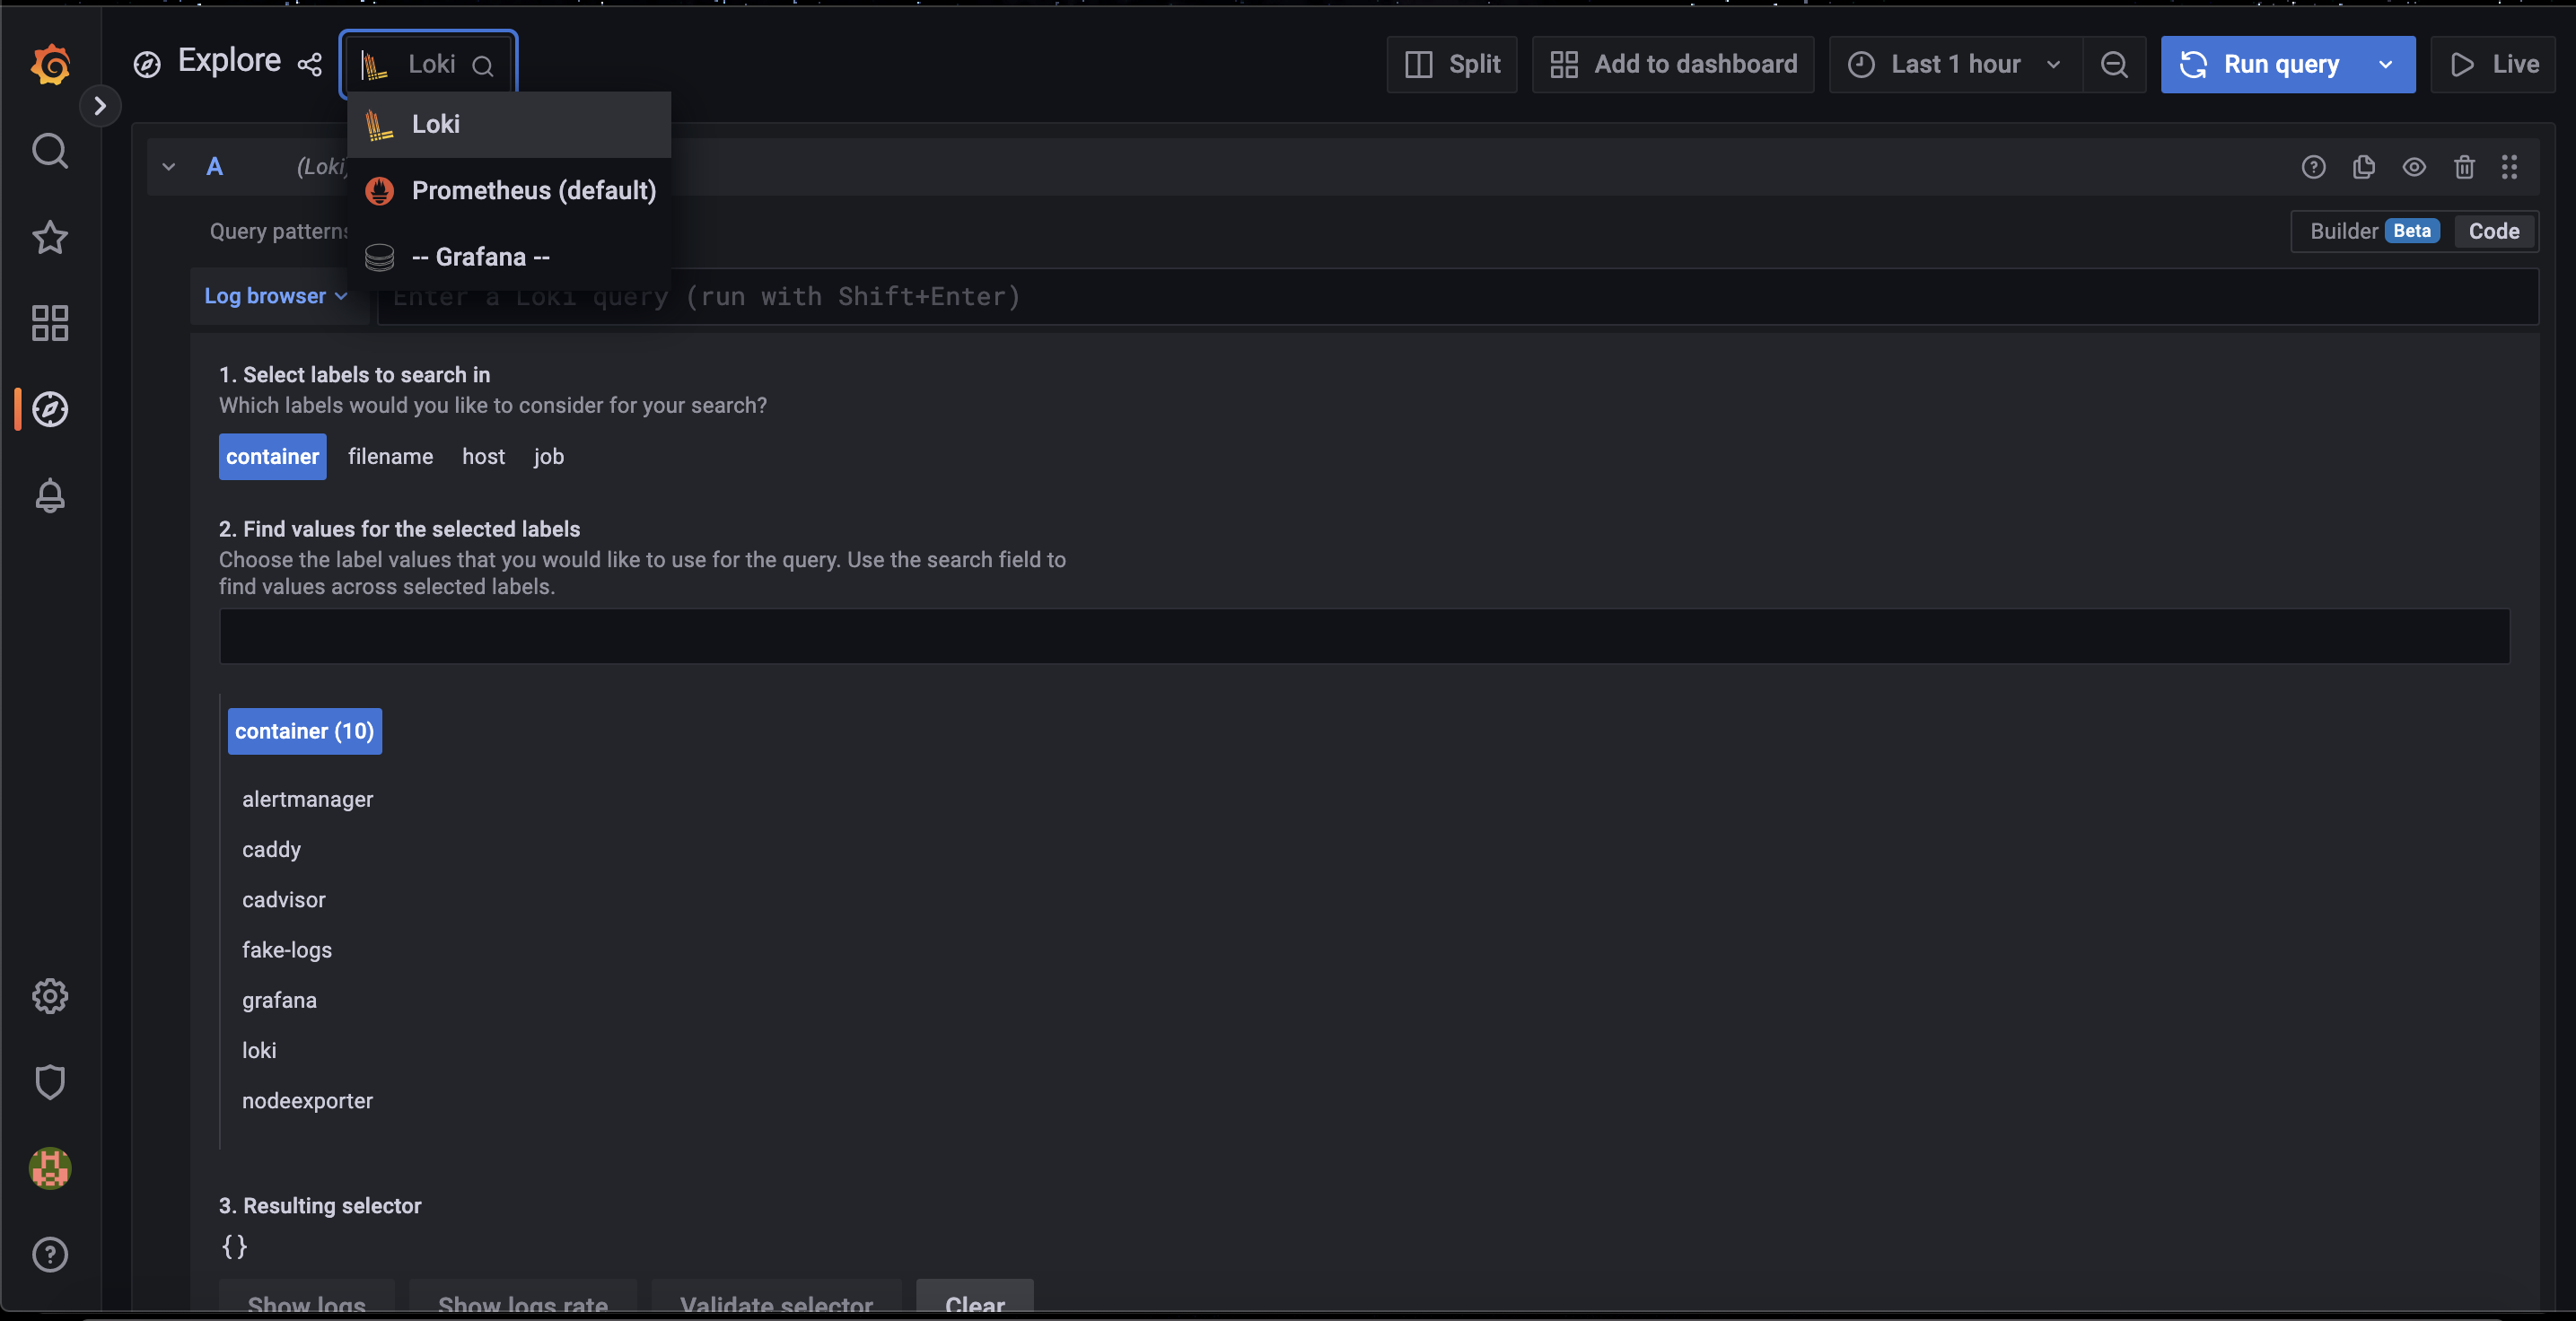
Next, select labels to view logs:
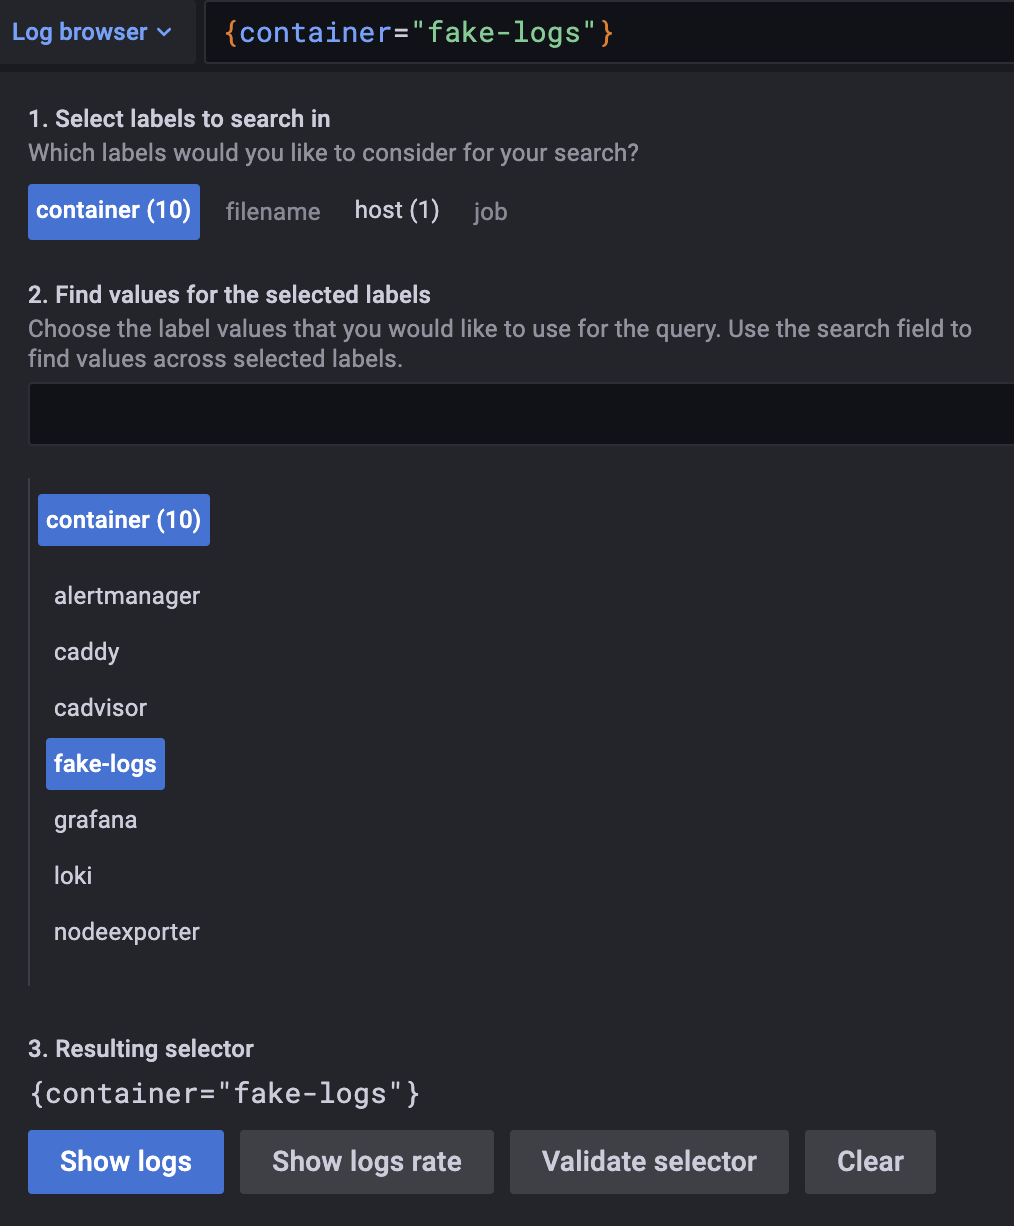
Ex: Select label container and view the newly created fake-logs container log:
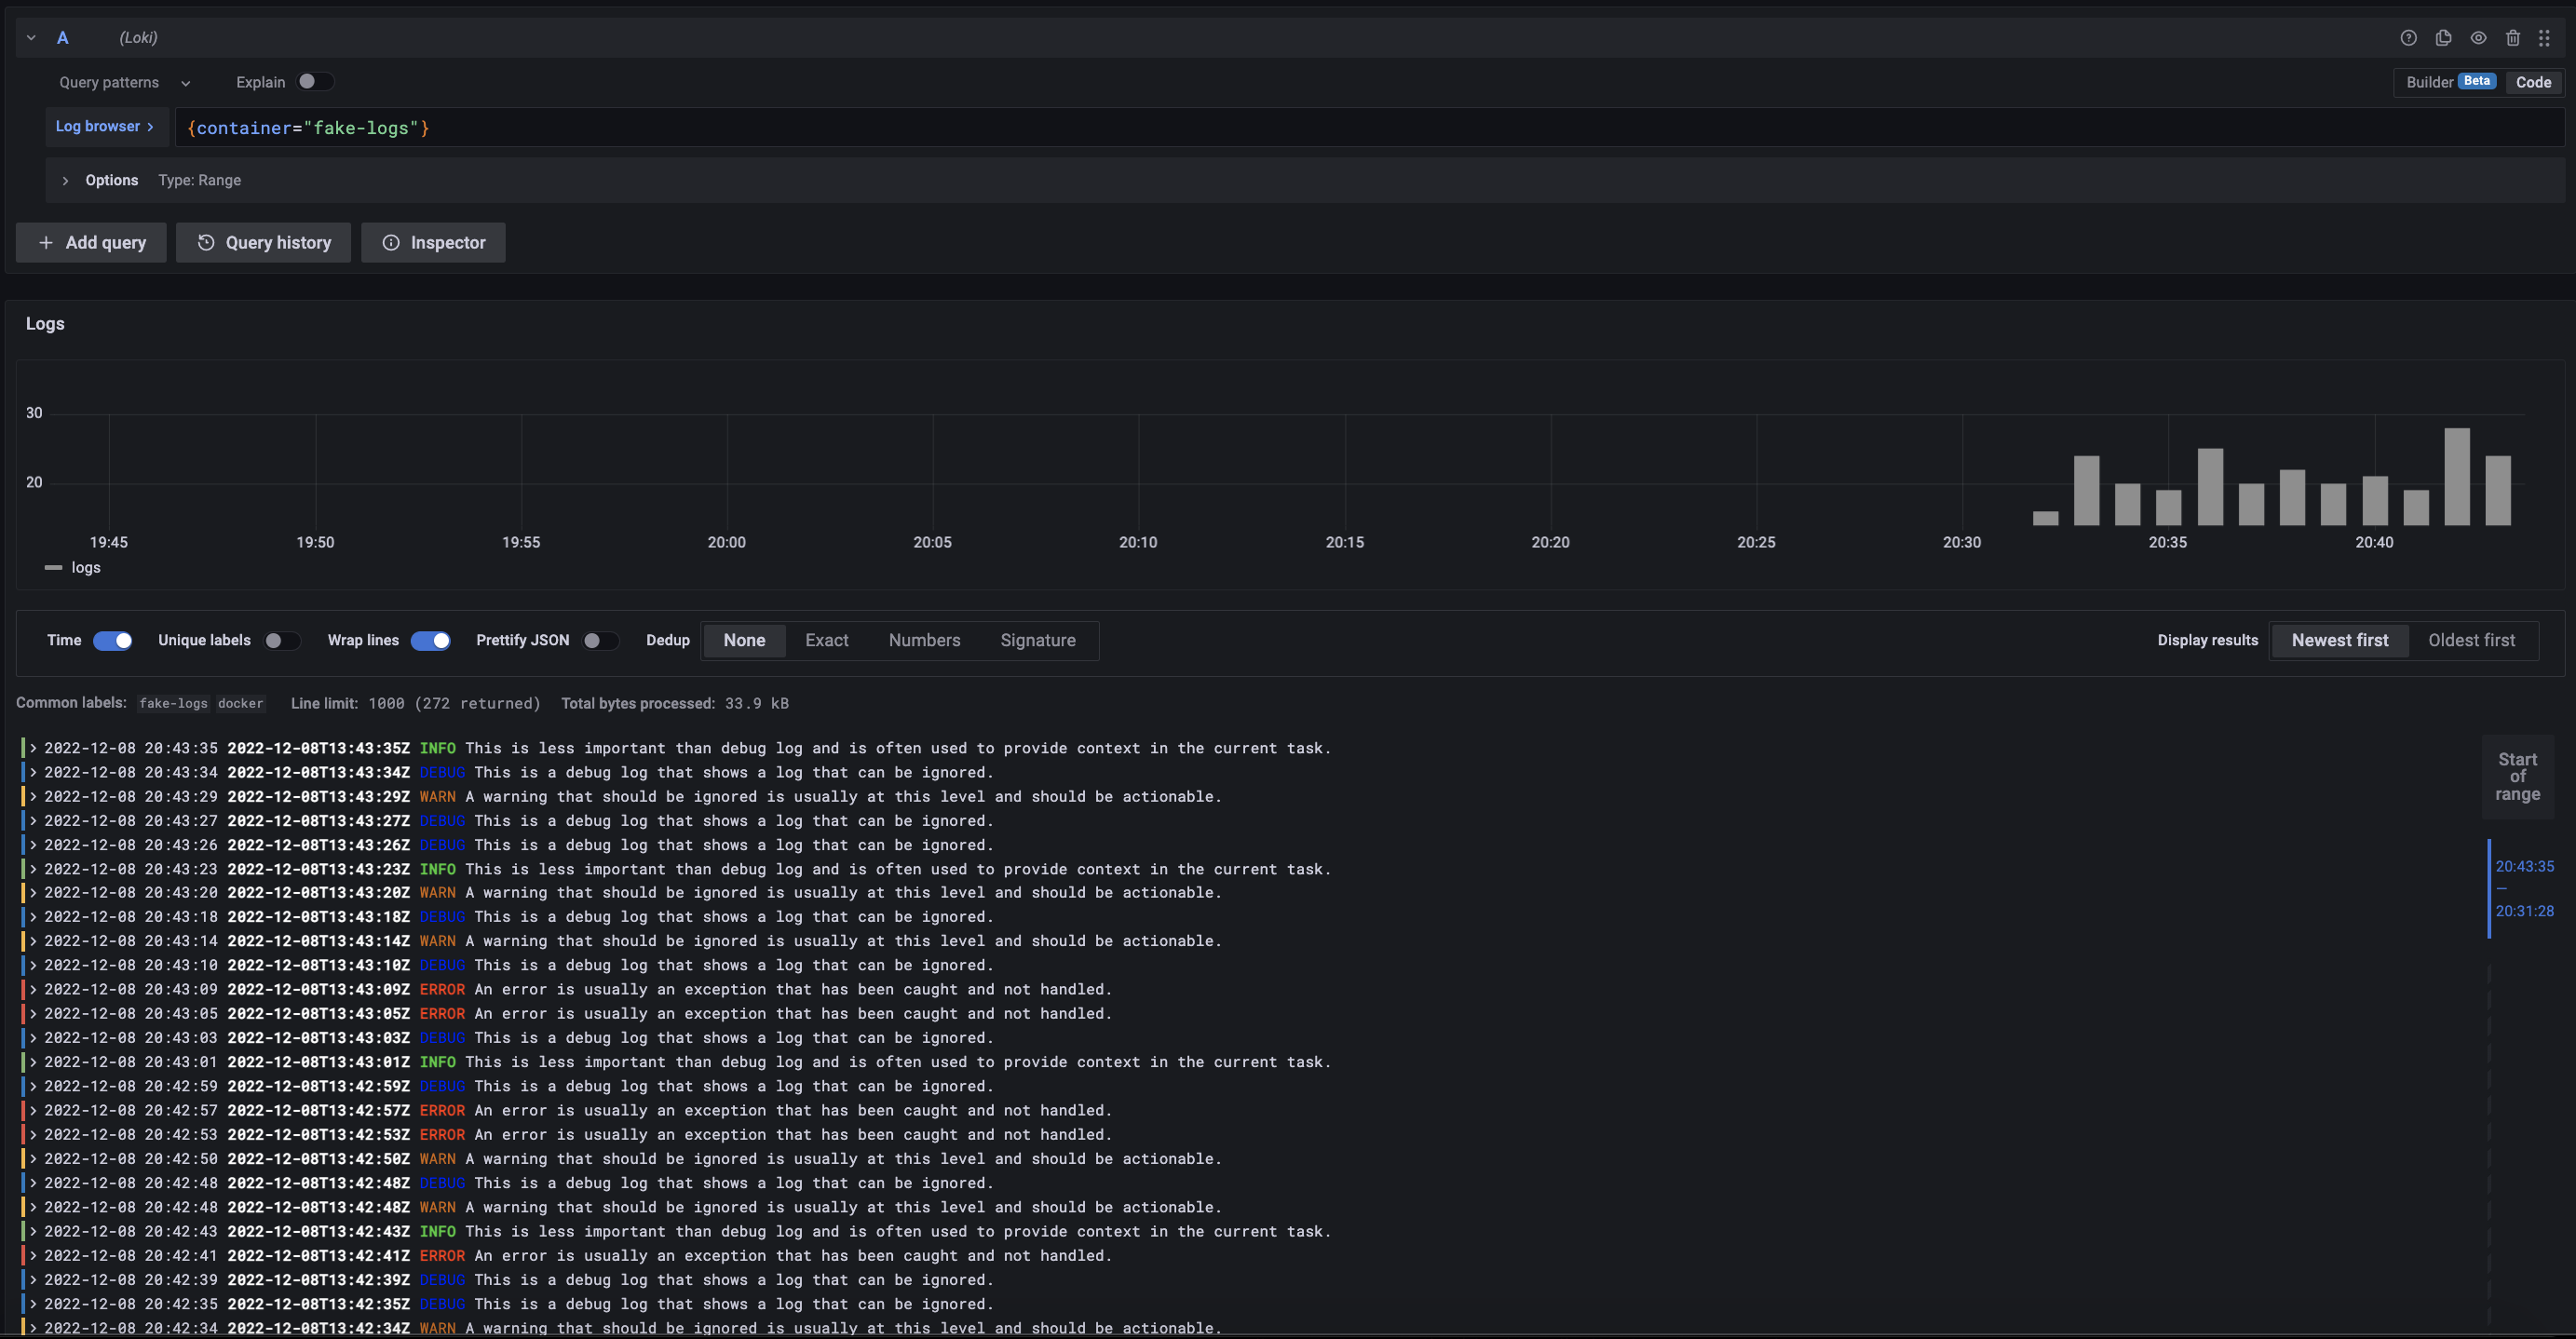
More logs: logs system, other containers, ….
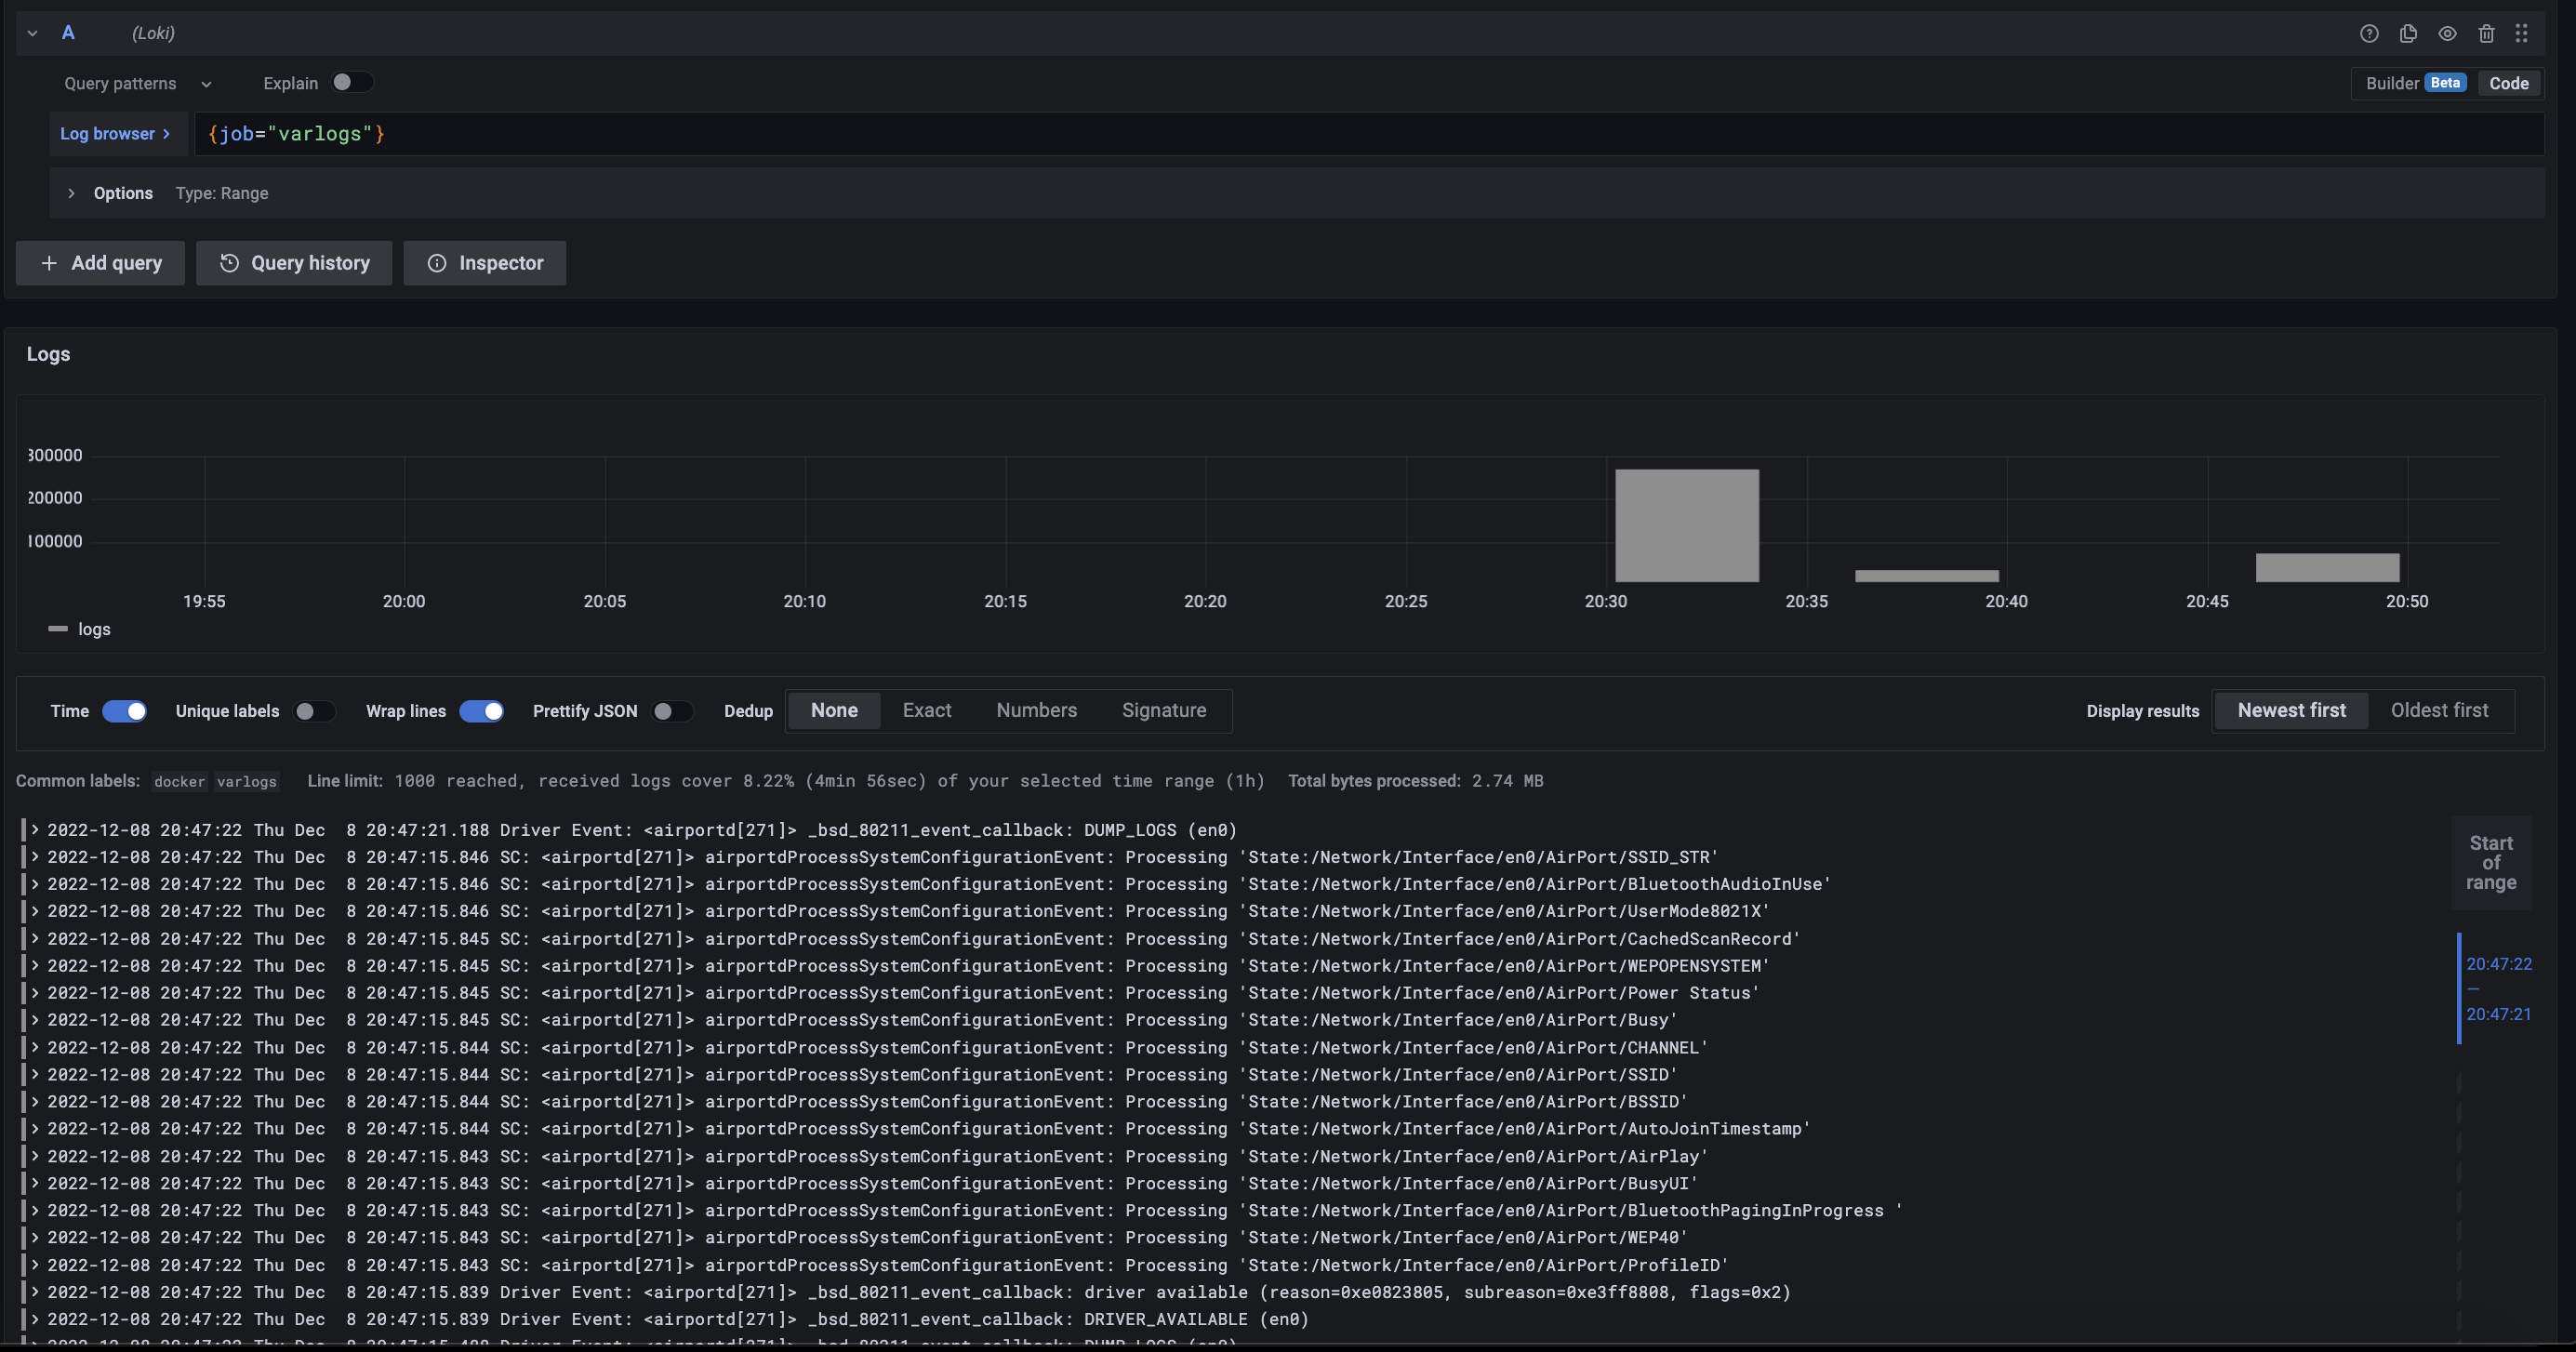
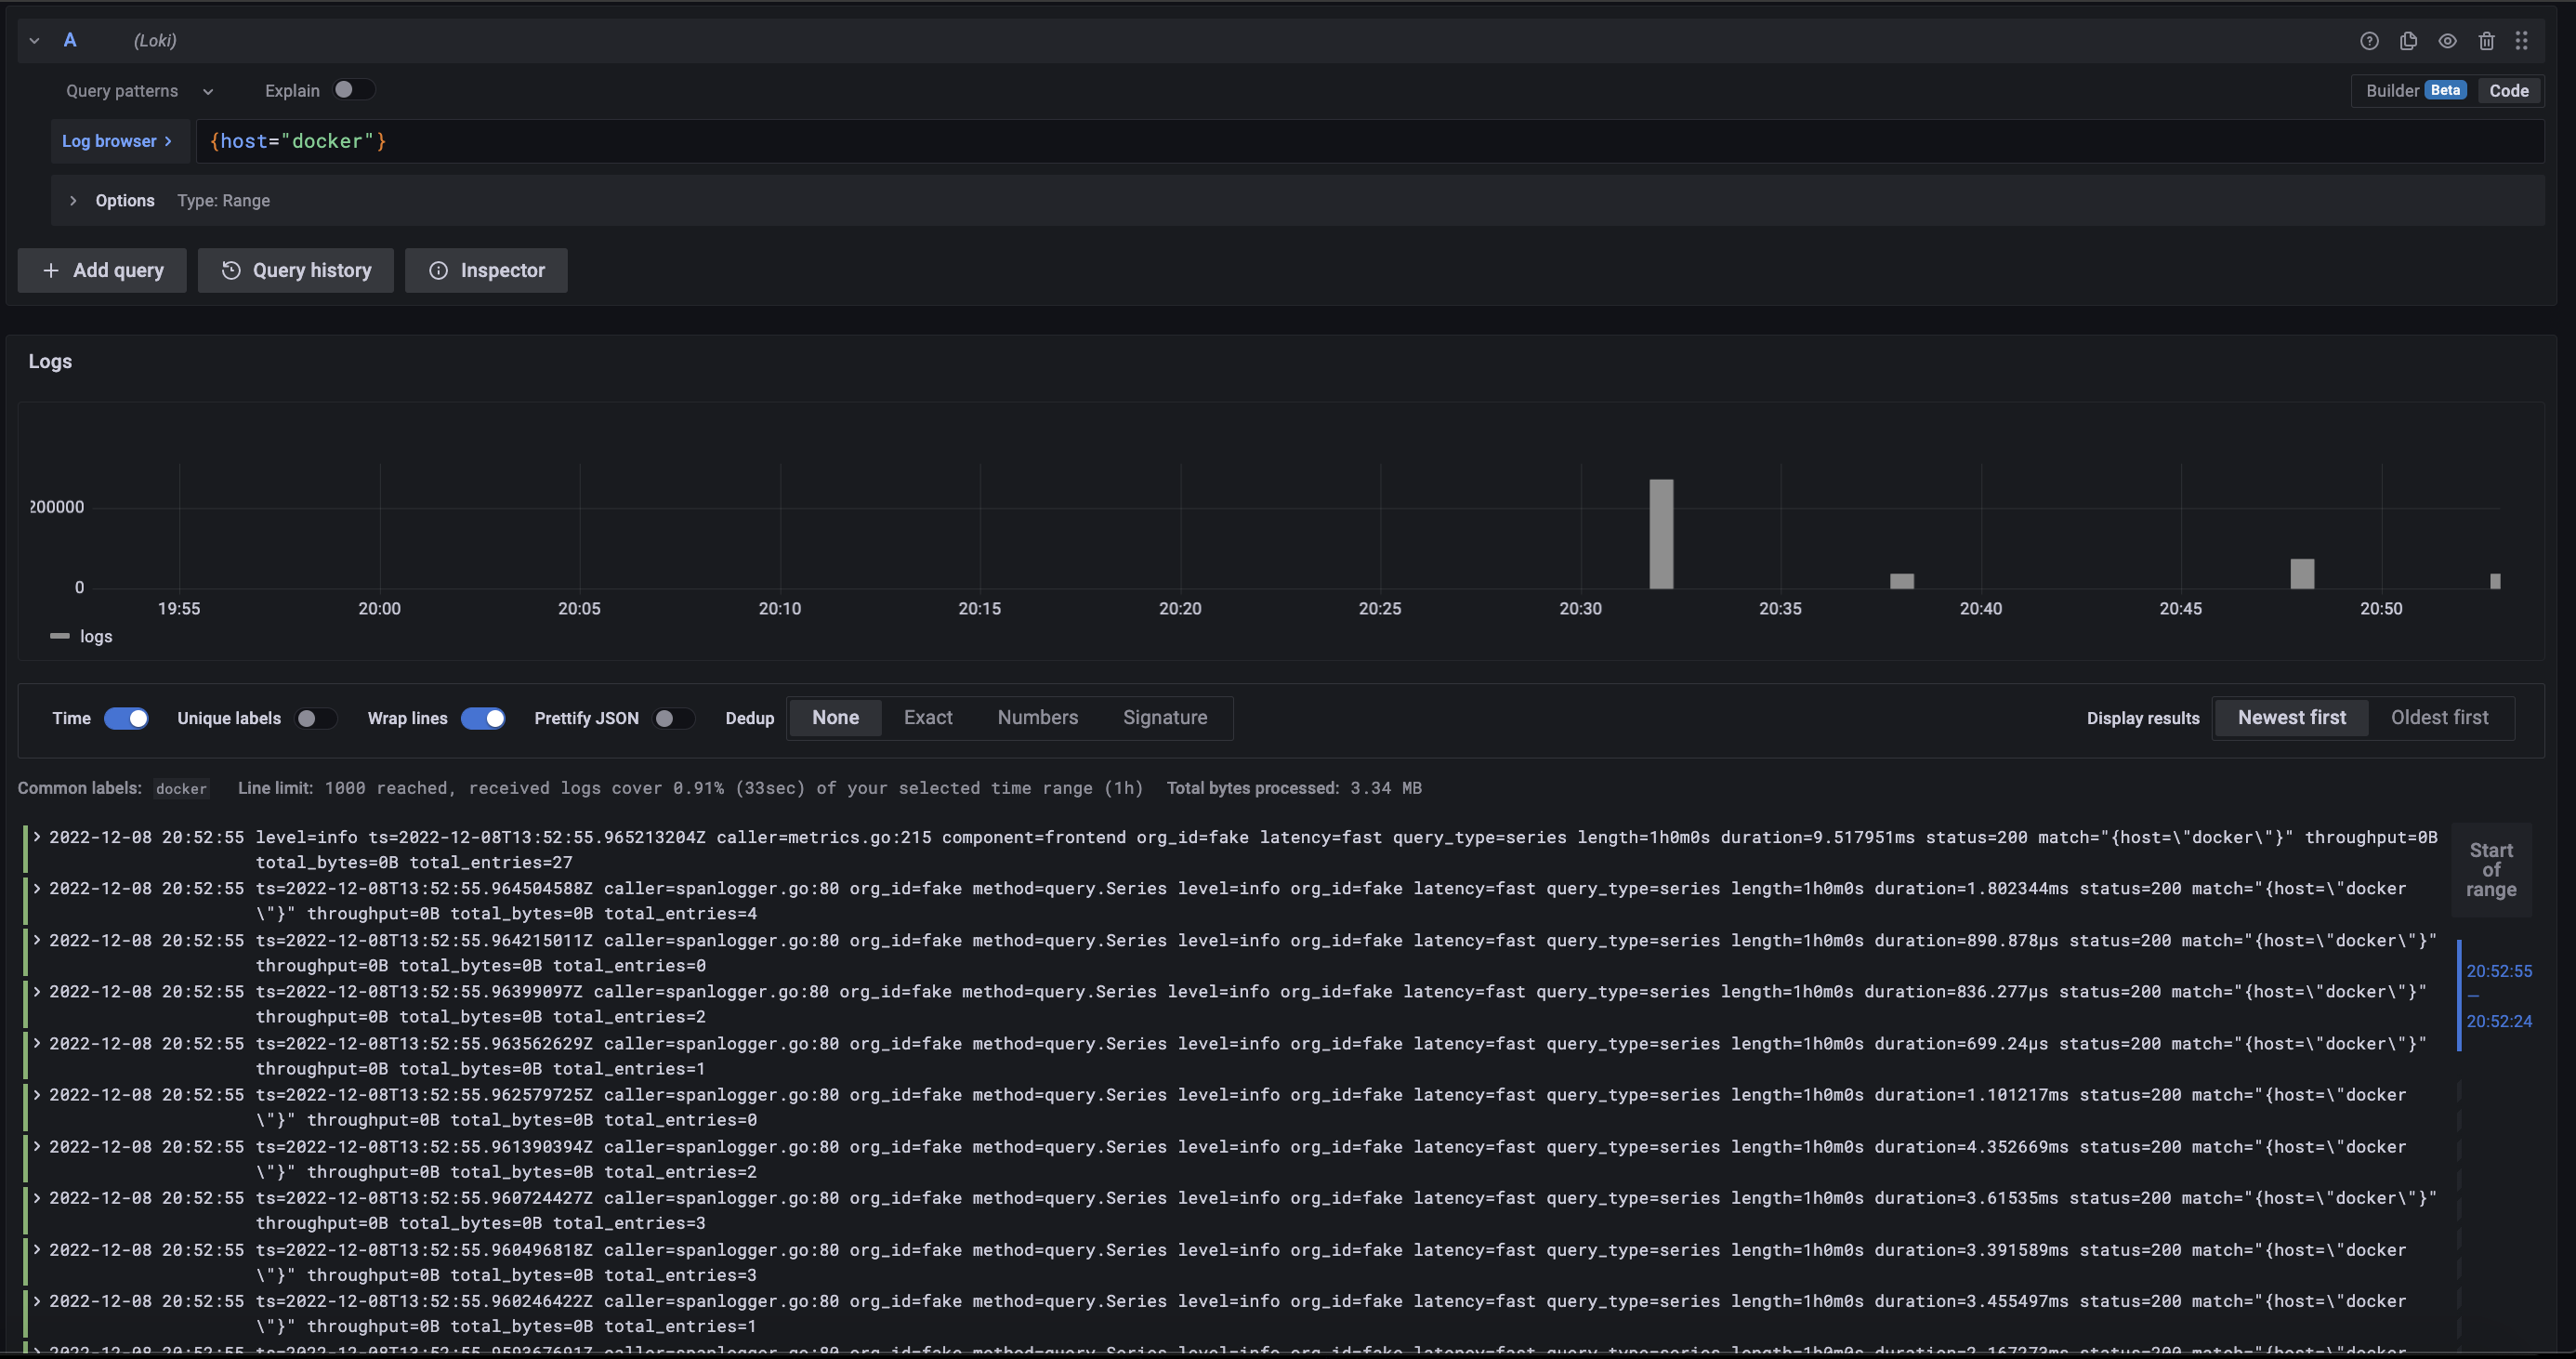
It looks fine too :v
Conclude
So I just showed how I set up a monitoring and logging system. If there is anything wrong or poorly presented, please give me more suggestions.
Thank you guys for reading!!!