Like most kids today who don’t seem to know why the sky is blue, what’s alarming is that the number of devs don’t (actually) know where their data came from and it’s been processed. how to manage and store. This article should be a starting point in a developer’s journey in understanding how it works.
Okey, a very simple query, no matter what level you start with, we’ve seen: Get all users in the db
1 2 | SELECT * FROM users; |
Sooo, Do you really know what’s going on between hitting enter in your psql terminal and getting the results back? Oh, I don’t know, and then found this post What’s behind a simple SQL query? Thanks to that, I also find the answer to the question just now, and hope that the translation will help you access the answer more easily.
Knowledge base
To understand this, let’s start with PostgresDB’s architecture! yoyoo
In a nutshell, it is a client / server application written in C ++. Client is anyone who accesses the DB, e.g. your psql terminal, Lambda function, JDBC driver, etc. and the server is PGDB backend, accepts your request, stores data, etc.
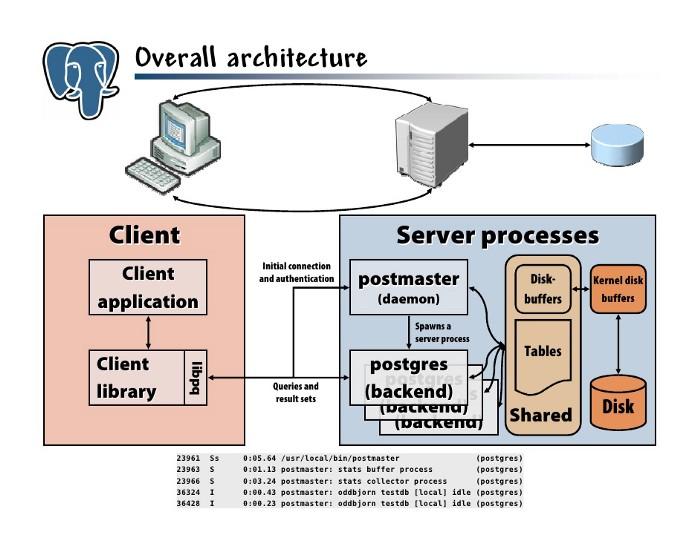
Here is a basic architecture overview of PostgresDB
You can find out more carefully in these 2 posts Architecture of PostgreSQL DB , Document of PostgresSQL
“Life path” of a query
Here’s a good overview of the “path of a query” in the official PostgresDB documentation.
1. Establish connections, pass queries and wait for results
PGDB can handle multiple connections simultaneously (via “postmaster”, see the architecture in the image above) and for each connection it creates a new process (“postgres”, continue to see the architecture). structure in the image above) to handle the requests (eg SQL statement) of the connection. In other words, it is a client / server model: “process per user”. postmaster handles the initial connection and authentication, then passes that connection over to a new postgres process. These processes communicate with each other using shared memory to ensure data integrity even with concurrent connections (remember the ACID?)
2. Analyze the query (Parsing the query)
It consists of 2 phases
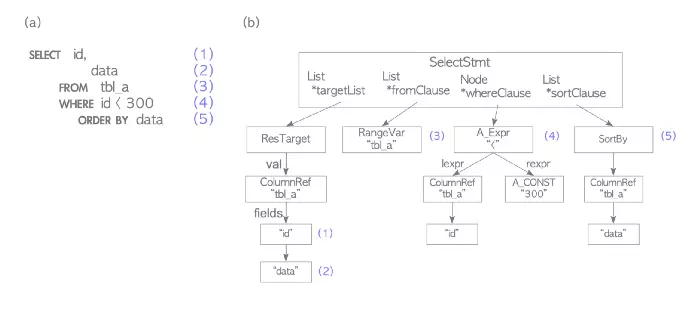
- Prsing – Parser: PGDB parser uses UNIX tool bison and flex as parser and lexer to validate if input query string (ASCII text) is a valid SQL query rate or not. This is only done with the fixed rules of SQL syntax without any understanding of the underlying semantics of the query string. The output is a parse tree:
- Transform: uses the parse tree to build the query tree, which contains the semantic interpretation of the query, for example the table, the data type, the operator, and which function is referenced. The root of the query tree is the query data structure defined here . Output:
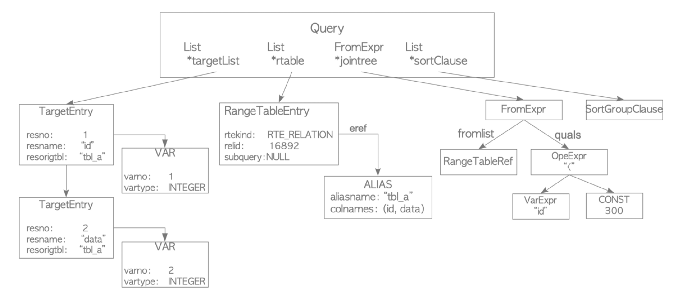
Learn a bit about Query: * targetList: the output of the query and its data type; in this case the id and data columns, both integers * rtable: refer to the table * jointree: hold the FROM and WHERE * sortClause operators: stores the sort of data
An important note directly from the top-fi-file docs:
The reason for separating raw parsing from semantic analysis is that system catalog lookups can only be done within a transaction, and we do not wish to start a transaction immediately upon receiving a query string. The raw parsing stage is sufficient to identify the transaction control commands (BEGIN, ROLLBACK, etc), and these can then be correctly executed without any further analysis. Once we know that we are dealing with an actual query (such as SELECT or UPDATE), it is okay to start a transaction if we’re not already in one. Only then can the transformation process be invoked.
3. Rewrite the query (The rewrite)
PGDB’s Rewrite system takes the query tree as input and performs transformations based on rules stored in the system catalog that can be applied to the query tree. The output is again a query tree. A good example is the implementation of views (virtual tables) in which the Rewrite system rewrites the user’s query to access the original tables in the defined View instead of the View alias.
A comprehensive example of how the Rule system works for views can be found here
4. The query plan (The query plan)
planner / optimizer uses a query tree rewritten from the last step to create the best / cheapest (= fastest / most efficient) execution plan for the query – the query plan . The optimizer considers all possible paths to execute the query. Unless the statement has a large number of joins, exceed the geqotreshold threshold – where considering all possibilities is not computationally feasible. In that case, a Generic Query Optimizer will be used instead.
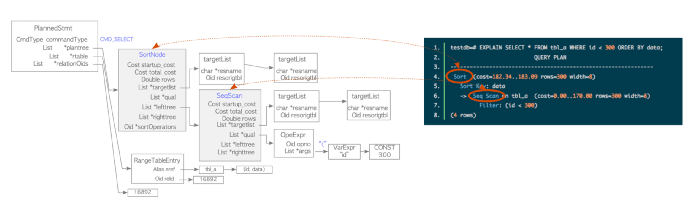
The example in the above diagram shows a simple example in which the executor must scan the tbl_a table sequentially followed by an sort. You can test your query plan by entering EXPLAIN before your query:
1 2 | EXPLAIN SELECT (...) |
5. Executor
Oop-fi-file’s explanation is the best
The executor recursively steps through the plan tree and retrieves rows in the way represented by the plan. The executor makes use of the storage system while scanning relations, performs sorts and joins, evaluates qualifications and finally hands back the rows derived.
The runtime is used to evaluate all four basic SQL query types: SELECT, INSERT, DELETE, and UPDATE. You can find more details about the executor’s steps for each type of query here .
Memory
Okey, Now you know (1) what happens when you connect to a PGDB and (2) how SQL queries are parsed, optimized, and executed. The only thing missing is the way the data is stored. There is a great article explaining this topic here , and below I will summarize it briefly.
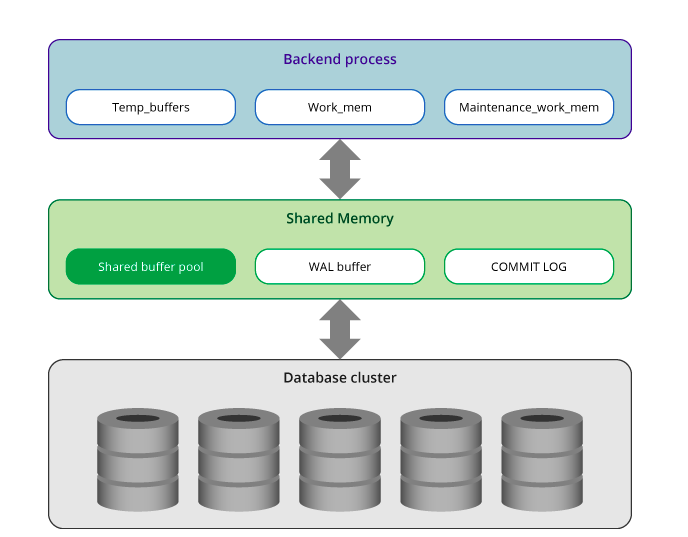
There are two types of memory: local memory and shared memory. Let’s find out.
1. Local memory
It is used by each postgres backend process. This memory is allocated by each process for query processing and consists of:
- temp_buffers: stores a temporary table by the executor
- work_mem: is used by the executor to joins, etc.
- maint_work_mem: maintenance operations like REINDEX
2. Shared memory
It is allocated when the PGDB server starts up and is used by all processes to ensure data integrity (remember the first part of the article?). This is also the memory that processes communicate – it does not normally communicate directly with the persistent memory. This shared memory includes:
- Shared buffer pool: where the pages in the table and index are loaded
- WAL buffer: Postgres has write ahead log which means that transactio log ensures no data is lost due to server failure. WAL data is stored in the WAL buffer before being converted to persistent storage.
- Commit log: stores all the status of the transaction as part of concurrency control.
You can adjust these values and the amount of memory allocated to them to increase the performance of your database. You can find more information about utilities for each memory section here .
Preferences
You should now have a basic understanding of the inner workings of one of the most popular databases! Hopefully this removes some of the stigma about “complex databases”. Maybe it will even inspire you to dig deeper and understand how you can optimize your apps by better understanding how your data is stored – one of the biggest bottlenecks in Modern software engineering.
Sources: