A debug guide for those of you who don’t know anything ^^
1. Overview
Today I will show you how to debug the most basic way. Debugging is a very important programming skill, but at the beginning you don’t really care about this. So when encountering a bug or exception, … investigating where the error occurred is very time-consuming but it is not sure that it has been able to find a place to fix it, so whether it is a junior or senior dev, you have to master this superfluous skill.
2. Basic concepts
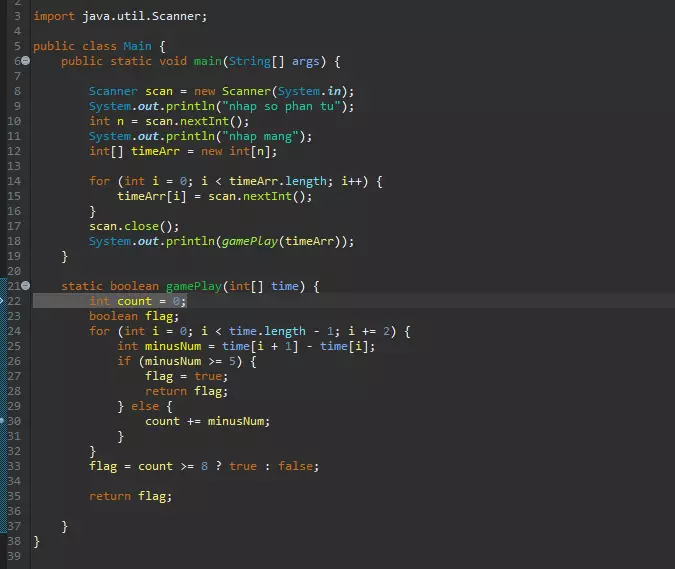
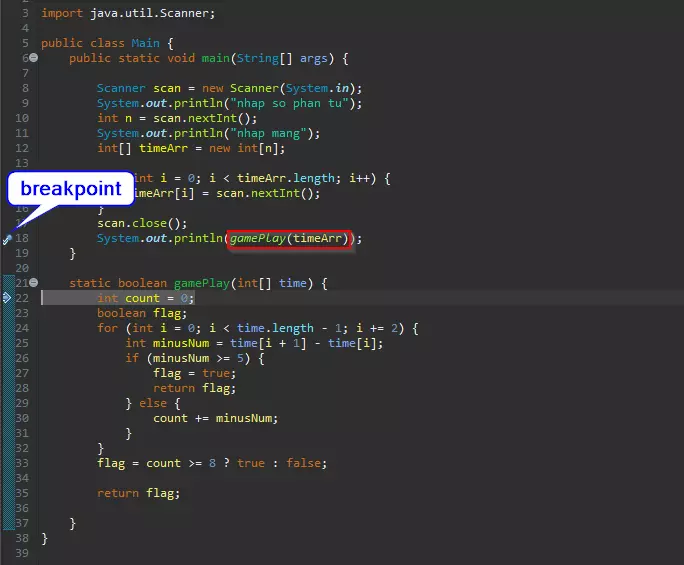
Here I have an example of the problem of calculating who is addicted to the game if they play at least 8 hours a day or play for 5 hours / day or more.
2.1.1. Debug Mode (Eclipse)
Eclipse has built-in debug and it is very powerful and easy to use. Here, right-click on the project or class where the main function is not -> then select debug. Because I am only running in the class without main function, I should select ‘Java Application’ and if java web, select ‘Spring Boot App’ , … depending on your program. I just taught you basic operations, and applications in your lesson, you have to be flexible 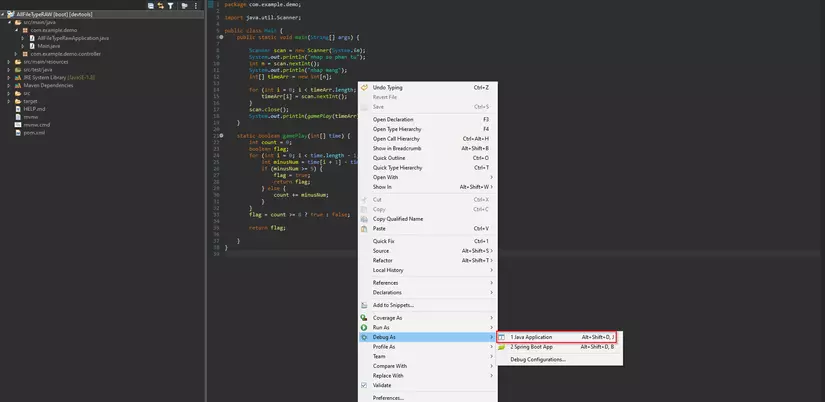
2.1.2. Breakpoints (Eclipse)
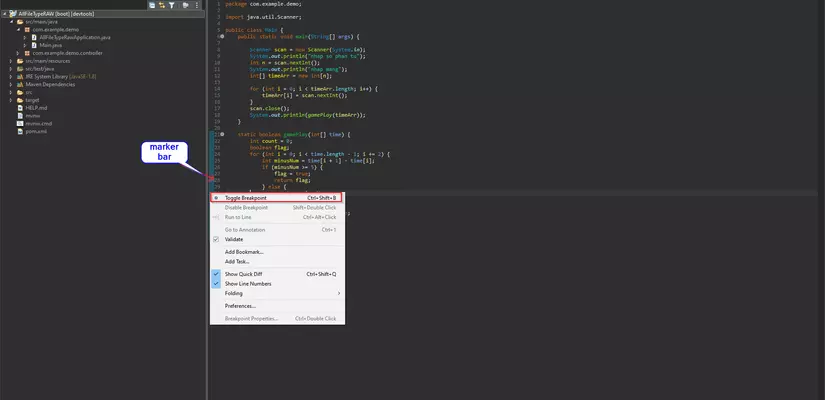
We need to identify the points at which program execution will pause for investigation. These are called breakpoints (that is, the program will stop there to investigate) and are applied to methods. They can also be identified at any time before or during execution. There are basically 3 ways to add a breakpoint to the program:
- Right-click on the marker bar, choose Toggle Breakpoint
- Click the line you want to debug, and press ctrl + shift + b
- Double click on the marker bar in the line you want to debug

2.1.3. Code-Flow Controls (Eclipse)
Now let’s try manipulating to see what debug helps me do
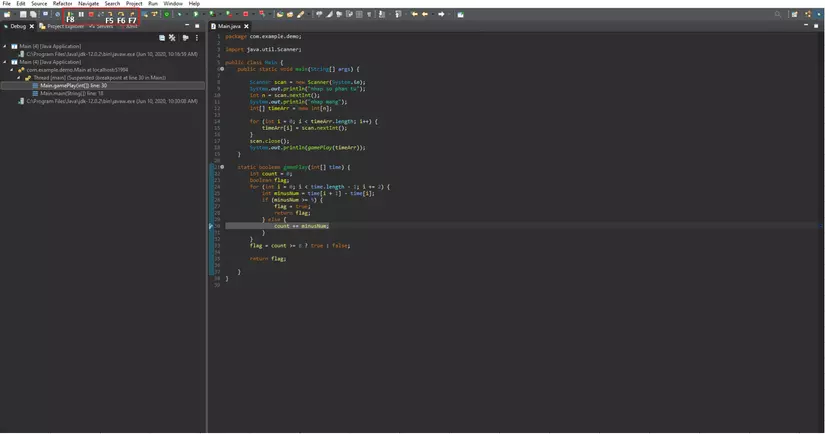
The most commonly used debug options:
- Step Into (F5) – This step goes inside the methods used in the current line (if any); otherwise it jumps to the next line. In this example, it will debug into the gamePlay () method.
- Step Over (F6) – This process processes the current line and moves to the next line. In this example, this will execute the gamePlay () method and proceed to the next line. Usually we use this because if it is me, I will always put a breakpoint in the function so at debug time it will run into the function always, whenever I press F6 so that it runs one line at a time so that I can investigate each line.
- Step Return (F7) – This will end the current method and return us to the calling method. In this case, if there is a breakpoint on line 30, which is setting a breakpoint inside the gamePlay () method, then pressing F7 will jump to line 18, where the gamePlay () method is called in the Main () function.
- Resume (F8) – This operation will run as usual without stopping until the program ends unless you set any breakpoints at the next processing.
3. Techniques
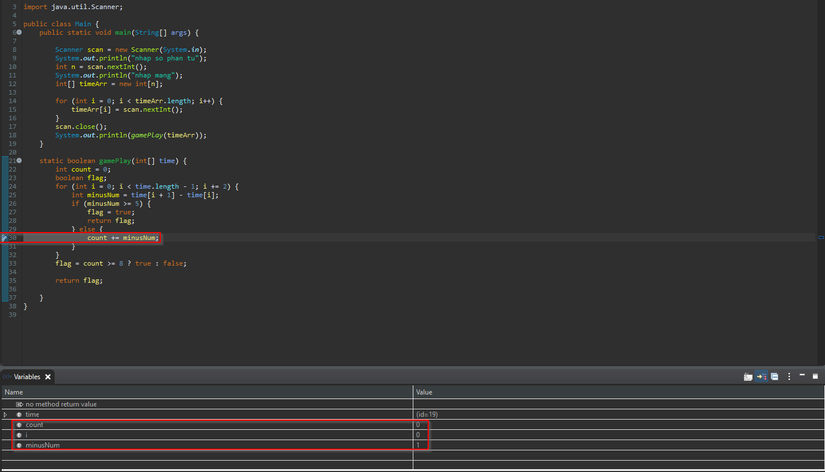
Usually we will use debug to check what the variable value or value on that line is, as we wish or not? It is also possible, t use debugging to find out how the program flow or business runs?
- When debugging run to any line, you can click on the function or variable that depends, then see its value
- Alternatively, you can go to the variables view tab to see the values of the variables each time the debug comes up, as in the following example:
Thank you for reading, the next part I will do about Visual Studio, if there are any errors, please let me know.